Market Update
Freight Market Update: March 7, 2024
Updates from the global supply chain and logistics world | March 07, 2024
Freight Market Update: March 7, 2024


Trends to Watch
[Air - Global] (Data Source: WorldACD/Accenture)
- Global air cargo tonnages increased in the last full week of February following the typical dip during the Lunar New Year (LNY), with significant surges in tonnages at key Asia-Europe sea-air hubs (Dubai, Colombo, Bangkok) due to disruptions in container shipping in the Red Sea.
- Dubai-Europe air cargo traffic in week 8 saw a more than double increase (+146%) compared to the same period last year, with recent weeks showing a +140% year-on-year (YoY) rise. Colombo-Europe and Bangkok-Europe also experienced significant YoY tonnage increases, indicating strong demand for air cargo as an alternative to disrupted sea routes.
- The sustained high demand for air cargo through these hubs into March is uncertain, but week 8 showed no signs of waning, contributing to a +9% week-on-week rise in global air cargo tonnages, partially recovering from previous drops during LNY.
- A broader two week comparison highlights the impact of LNY and Valentine's Day on demand, with significant tonnage decreases from Asia Pacific and Central & South America, but a notable rise from the Middle East & South Asia region. Global average prices fell by -6% due to these fluctuations, despite a price rise from the Middle East & South Asia.
- Year-on-year data reveals a -4% decrease in worldwide tonnages for weeks 7 and 8, with a significant drop ex-Asia Pacific but a notable increase ex-Middle East & South Asia. Average global rates remain above pre-COVID levels, though they have decreased compared to the previous year, with worldwide air cargo capacity significantly up (+8%).
[Ocean - FEWB]
- The Red Sea Crisis is continuously impacting freight market development. With most of the vessels routed via the Cape of Good Hope, carriers believe the supply will still be balanced with demand in a mid-run. The Lunar New Year (LNY) soft demand is temporary, however, equipment is in better shape (mainly because of LNY slow recovery). Carriers are also investigating the situation and re-routing back via the Suez Canal. More details to follow as information is made available.
- Demand remains flat post LNY. Carriers are further adjusting rates to cater fresh cargo in 1H March. PSS/Contingency Surcharges are still being upheld by carriers due to the reroute, however, more questions about the actual additional cost are being brought up and we expect there will be adjustments in March.
- Ocean Alliance continuously announced voided plans for March. With 2M’s Winter Program ending, carriers are actively investigating the demand & supply. If soft demand continues from Week 12 onwards, we expect there may be more blank sailings announced.
- To mitigate the disruption of operational challenges (sailing schedule adjustments, vessel downsizes, equipment shortages, rollover, etc.), shippers can consider premium services offered by liners with higher costs. This approach will help guarantee space and equipment and shorten delays.
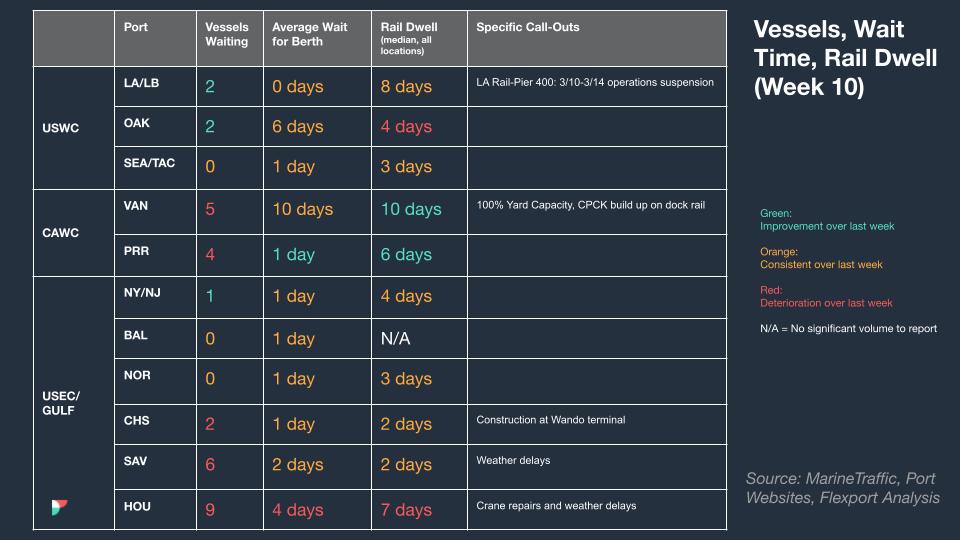
North America Vessel Dwell Times
Webinars
North America Freight Market Update Live
Thursday, March 14 at 9:00 AM PT / 12:00 PM ET
Flexport Platform Demo | Europe
Thursday, March 14 at 10:00 GMT / 11:00 CET
New! Flexport Ocean Timeliness Indicator
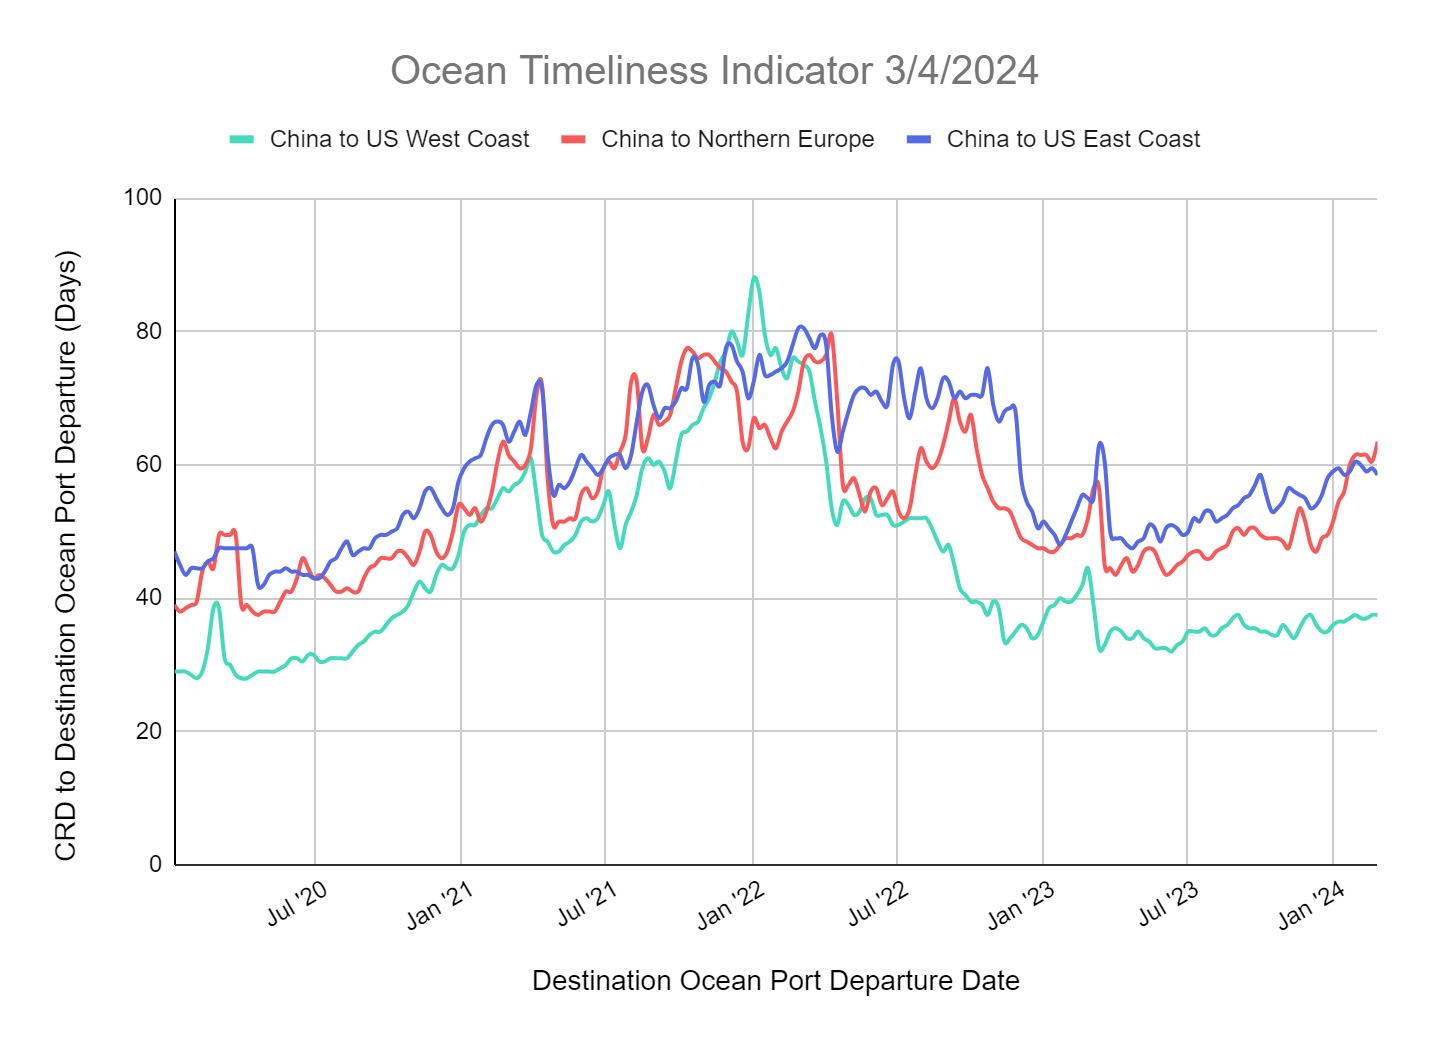
Ocean Timeliness Indicators for China to Northern Europe Increase While China to U.S. East/West Coast Stabilize
Welcome to the new Ocean Timeliness Indicator! Due to ongoing global shipping events in the Panama and Suez Canal, we have refined our previous report by splitting the Transpacific Eastbound trade lane into two subtradelanes: TPEB to the U.S. West Coast, and TPEB to the U.S. East Coast.
The Methodology: The Flexport Ocean Timeliness Indicator (OTI) utilizes data from Flexport’s ocean shipping operations for an expansive view of the cargo’s journey. Updated on a weekly basis, the Flexport OTI shows the transit time from the cargo ready date at the exporters’ factory or warehouse to the containers’ departure from the destination ocean port. The ocean shipping world tends to run along “trade lanes.” The three biggest east-west trade lanes carry goods from Asia to the U.S. West Coast, Asia to the U.S. East Coast, and from Asia to Northern Europe. The OTI captures the timeliness of each. As there are many transit time nuances from port to port and service to service, to show accurate trends, the OTI uses the following logic:
- Excludes premium services
- Displayed transit times are based on a trailing two-week median
- Major origin and destination ports are used as a proxy for the overall trade lane to create clear trends. Other origin or destination ports will have additional transit time considerations based on ocean carrier services.
*- Asia to U.S. West Coast trade lane uses the China ports of Shanghai and Ningbo and the U.S. West Coast ports of Los Angeles/Long Beach.
- Asia to U.S. East Coast trade lane uses the China ports of Shanghai and Ningbo and the U.S. East Coast ports of New York/New Jersey and Norfolk.
- Asia to North Europe trade lane uses the China ports of Shanghai and Ningbo and the North Europe port of Rotterdam.
Week to March 4, 2024
This week, the OTI for China to Northern Europe increased to 63 days due to carrier re-routings from the Suez Canal to the Cape of Good Hope. These transit times have begun to normalize but will change when carriers decide to transit the Red Sea again. The OTI for China to the U.S. East Coast remains elevated at 59 days as some carriers route westward around Cape of Good Hope while most leverage the Panama Canal despite slot restrictions. The OTI for China to the U.S. West Coast remains at 37 days as the transit time impact from the Red Sea situation is minimal.
Please direct questions about the Flexport OTI to press@flexport.com.
The contents of this report are made available for informational purposes only. Flexport does not guarantee, represent, or warrant any of the contents of this report because they are based on our current beliefs, expectations, and assumptions, about which there can be no assurance due to various anticipated and unanticipated events that may occur. Neither Flexport nor its advisors or affiliates shall be liable for any losses that arise in any way due to the reliance on the contents contained in this report.
About the Author
Related Content


Sign Up for Freight Market Updates
Why search for updates when we can send them to you?