

June 16, 2022
Understanding the Trade Activity Forecast

Understanding the Trade Activity Forecast

Which industries have driven the U.S. trade boom? Where might they go next? What will be the impact on the wider economy? Flexport’s Trade Activity Forecast (TAF) was launched in October 2021 to provide a guide to the outlook for U.S. merchandise imports. We have expanded the TAF to include U.S. exports and a gauge of the U.S. trade deficit. Our initial estimate indicates U.S. merchandise imports will grow by 3.7% sequentially in May and exports will dip by 1.2% while the trade deficit will reach $352 billion in Q2’22.
The State of U.S. Trade
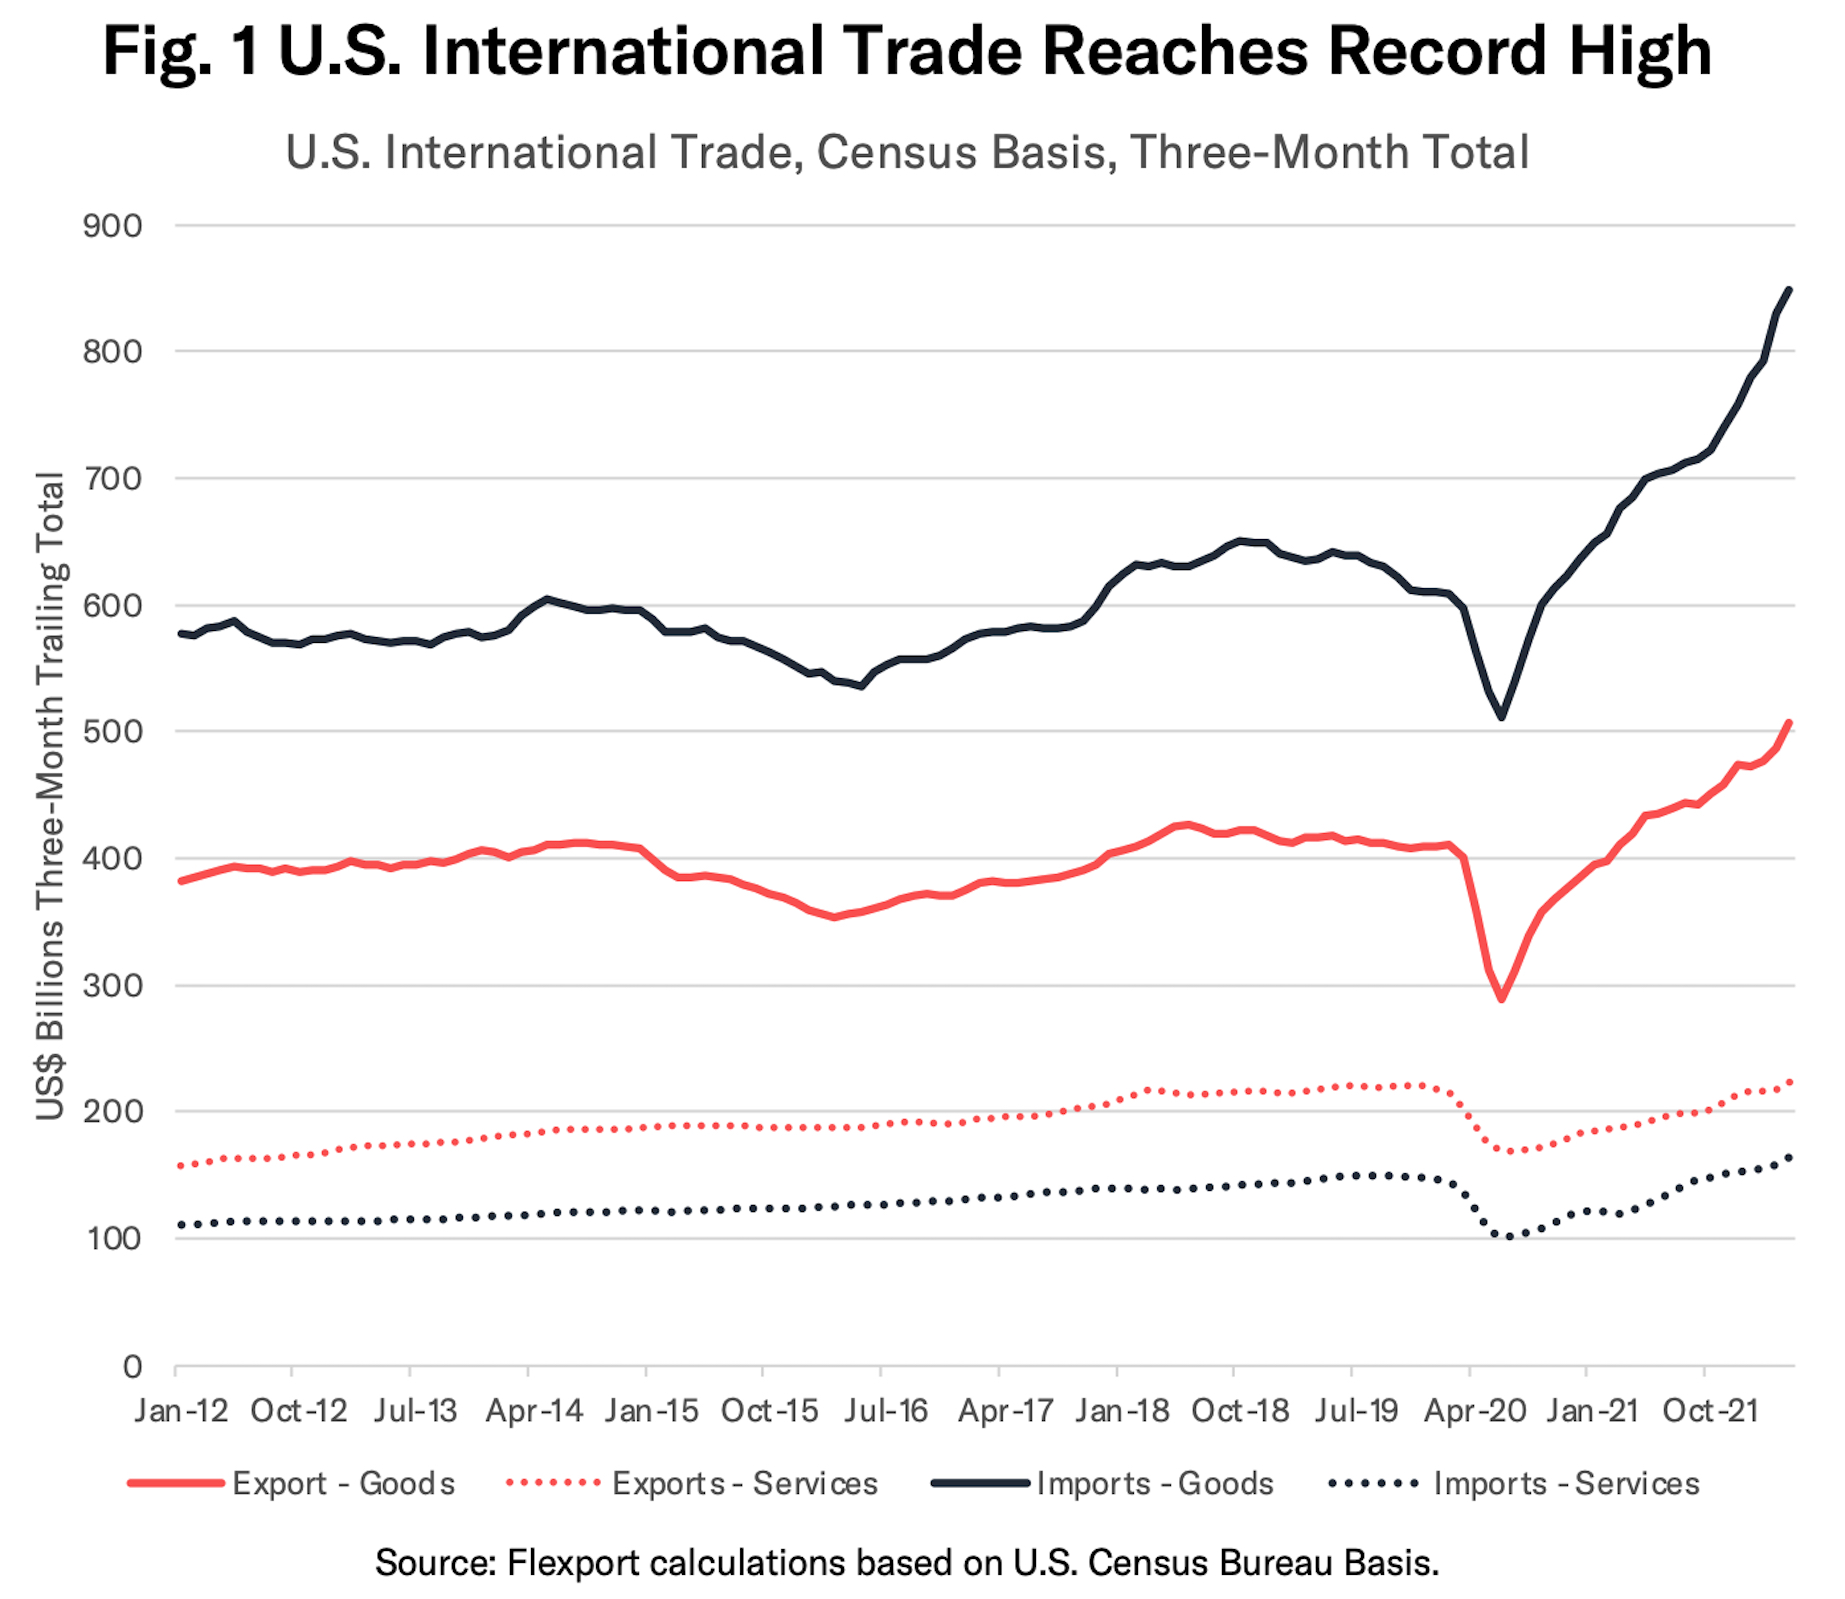
U.S. international trade activity climbed by 23% year over year in the three months to April 30, 2022 and also by 23% compared to the same period of 2019 to reach $592 billion on a census basis in April. The increase vs. 2019 was driven by a 29% jump in trade in goods while services rose by 6%.
As shown in Figure 1 above, imports of goods have outpaced exports, partly reflecting the impact of elevated U.S. consumer spending power versus the rest of the world (stronger dollar).
The TAF Methodology and Interpretation
The question arises: where might merchandise trade activity go next?
The U.S. Census Bureau publishes international trade data at a lag. Advance figures covering headline merchandise trade including industry aggregates are typically reported four weeks after the end of the month. Full figures, including product–level data as well as services trade information, arrive after six weeks.
In common with Flexport’s Post-Covid Indicator, the TAF is produced using a mixture of traditional momentum-based economic forecasting techniques combined with insights from Flexport’s shipping data.
The latter provides something of a back-stage pass for the trade sector and provides additional data on products due to arrive in (or leave) the U.S. before they enter the aggregated trade statistics. Our analysis suggests the addition of Flexport data significantly reduces the forecast error versus momentum-only forecasts.

As discussed in prior research, there are several “flavors” of trade data available.They are produced on a Census or ‘balance-of-payments’ basis, and differ based on whether they are adjusted for seasonality or not.
The Census, non-seasonally adjusted versions, shown as the dotted lines in Figure 2, are suited for users looking for a guide to activity within supply chains on a short-term basis. This captures the unadulterated forecast of how many goods are expected to cross U.S. borders. The rate of growth in imports is expected to accelerate to 26% year over year in May, the fastest rate since June 2021. Exports, meanwhile, are expected to increase by a more modest 20%.
The balance-of-payments version, particularly when seasonally adjusted, is a key input for forecasting the wider state of the economy via the inclusion of net exports in the Gross Domestic Product calculation. When seasonal adjustments are added, this answers the question: are imports likely to be higher or lower than we would normally expect for this time of year?
As shown in Figure 2 in the solid lines above U.S. imports on a balance-of-payments basis are expected to increase 3.7% sequentially in May while exports may fall by 1.2%. On a quarterly trend basis—most commonly used in reporting GDP, imports are expected to increase by 6.4% in Q2’22 versus Q1’22 while exports may grow by a more moderate 7.9%.
The Importance of (Commodity) Price Inflation
So what’s driving the outlook for imports and exports?
Flexport’s TAF is based on five key industries, plus an “others” category, which are common across imports and exports.
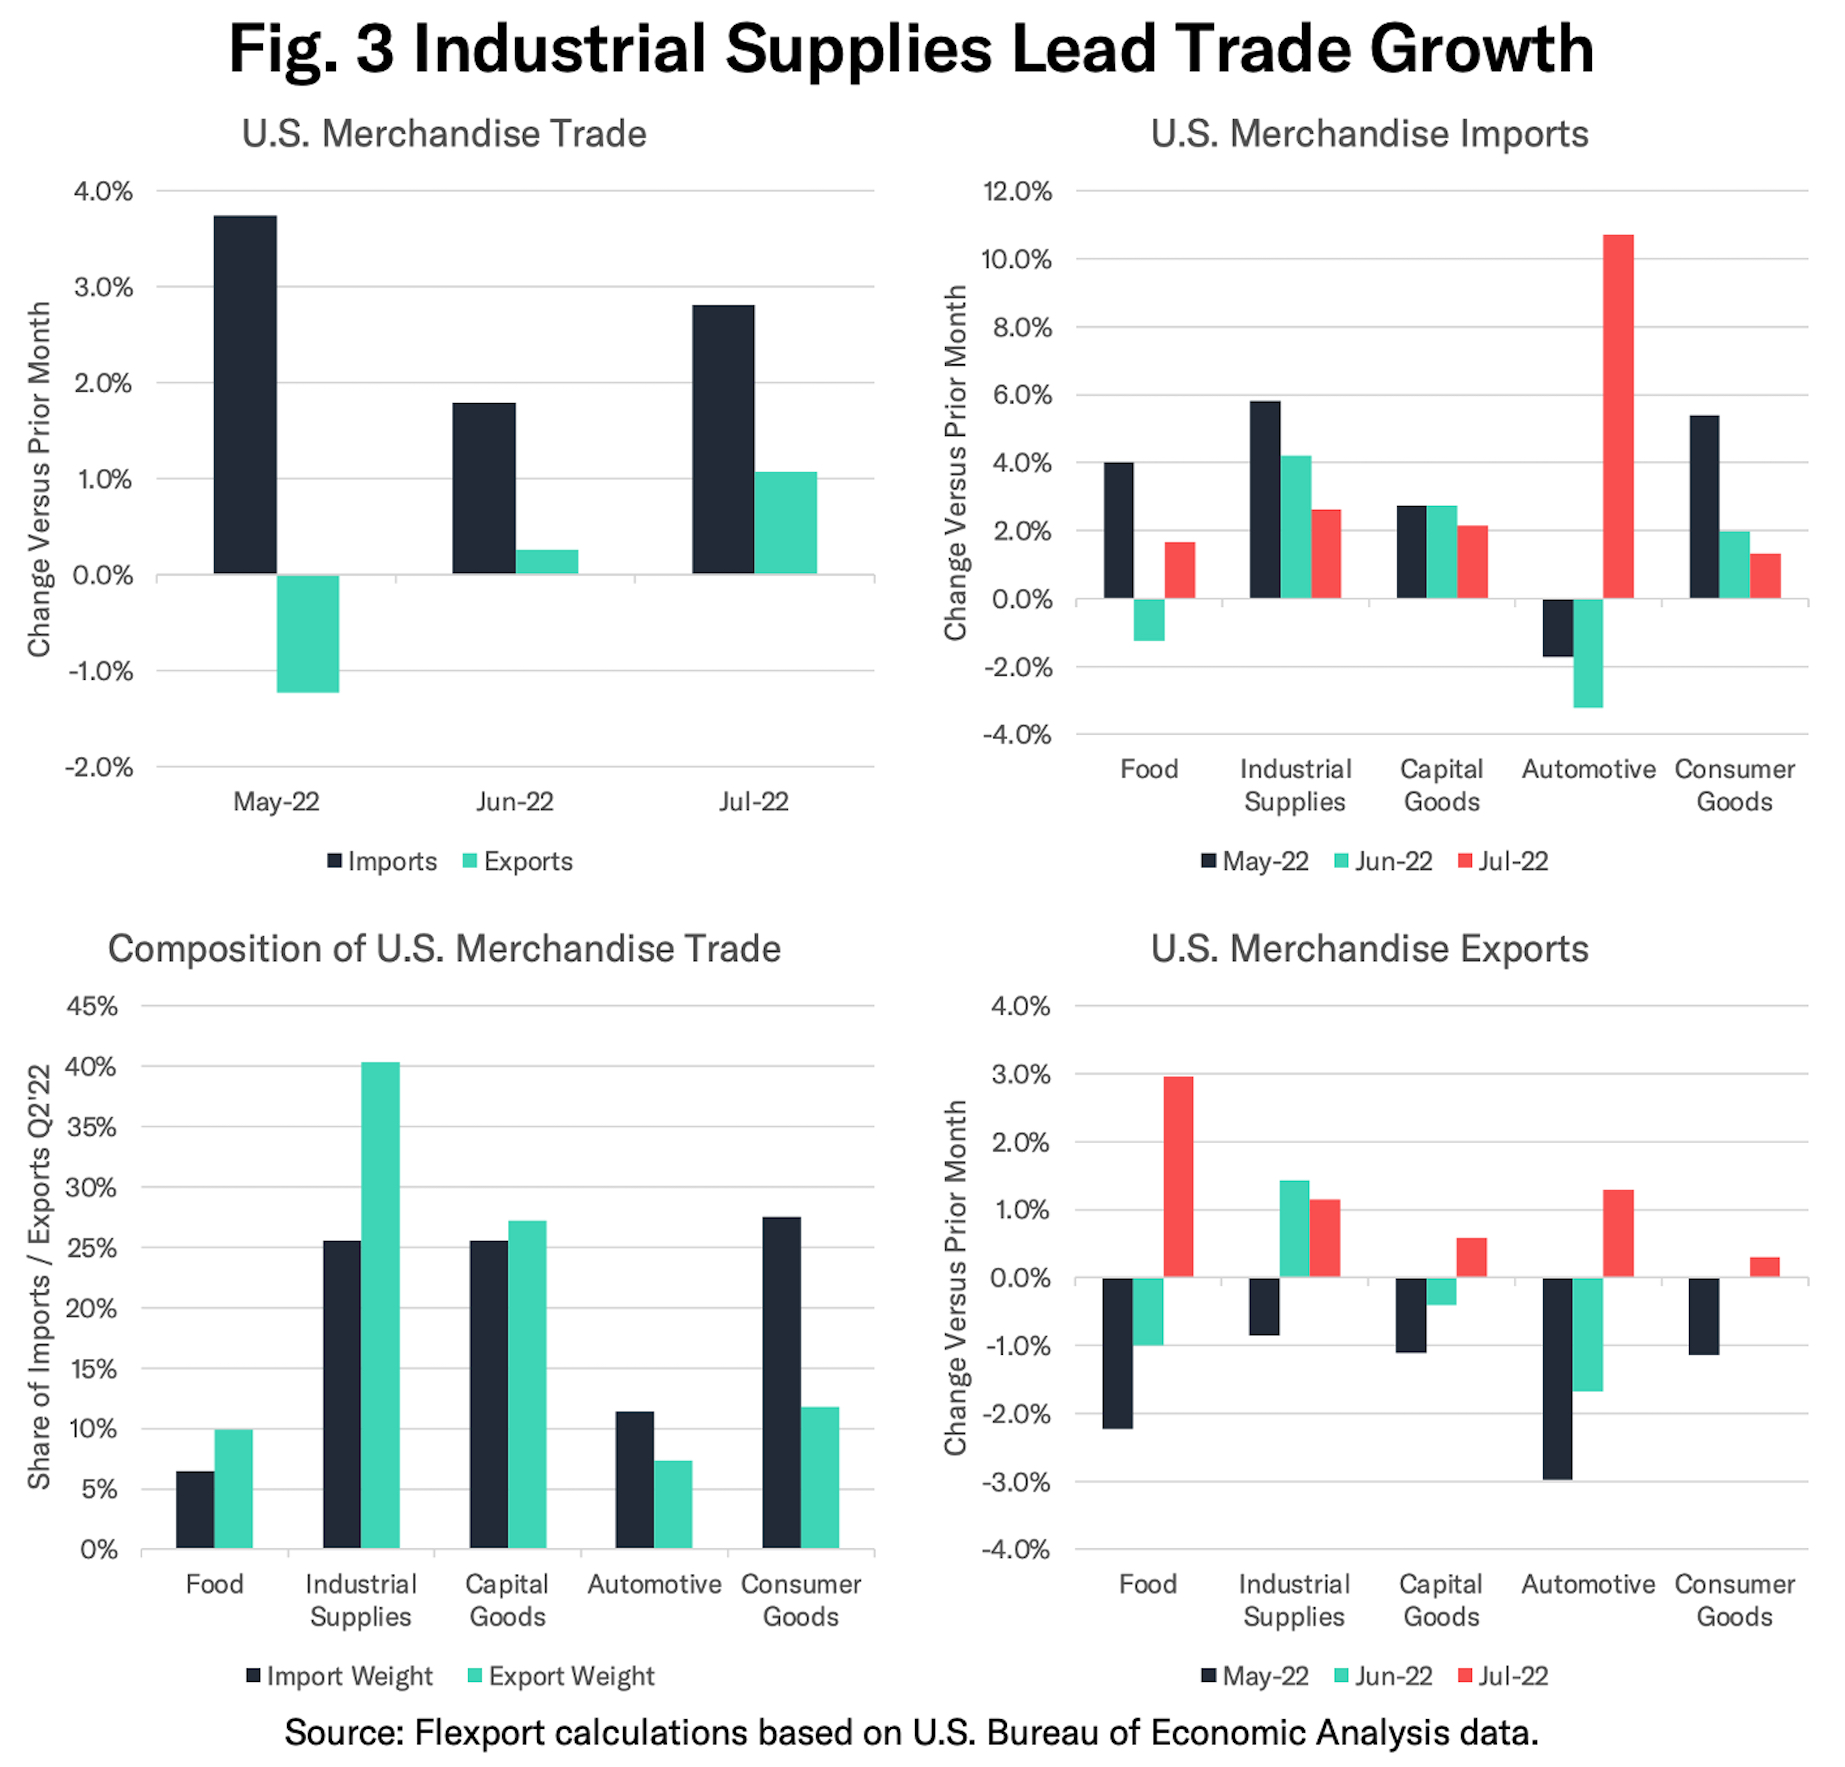
In the case of imports, on a balance of payments, seasonally adjusted basis, there is a broad spread of growth drivers with industrial supplies (commodities), capital goods and consumer goods each representing around a quarter of the forecast. Food and autos represent the remainder as shown in the bottom left chart of Figure 3 above.
For imports, three of the five categories are expected to continue to expand in the May to July period sequentially on a balance-of-payments, seasonally-adjusted basis. Industrial supplies are expected to grow the fastest and include imports of raw materials including energy, petrochemicals and metals among others, indicated in the top left chart of figure 3. There’s been a surge in global commodity prices in part as a result of the conflict in Ukraine.
The outlook for exports meanwhile, shown in the bottom right chart of Figure 3, is even more reliant on industrial supplies, which account for 40% of exports in Q2’22. The growth in industrial supplies is also expected to be more modest. Exports of capital goods, autos, and food are expected to decline in May and June with the prospect of a rebound in July while consumer goods are expected to be little changed.
The Outlook for the (Trade) Economy
While trade values matter for the logistics industry, do they matter for the economy at large?
The trade-in-goods deficit (or more accurately “net exports”) has been repeatedly miscast as the villain of international trade policy over the past five years. This usually has to do with the misinterpretation of an accounting identity.
The identity states that:
Output (Y) = Consumption (C) + Investment (I) and Government (G) + Net Exports (X-M)
The output in question is also Gross Domestic Product (GDP). So, suppose we consume more imports. In this equation, M goes up, Net Exports goes down (equivalent to the trade deficit increasing) and GDP decreases. Simple, right?
This is where the misinterpretation comes in. Let’s say that the increase in imports comes from the consumption of an additional $30K car that was made in Mexico. Holding everything else constant, M goes up by $30K. But we won’t hold everything constant. That car is consumed; C also goes up by $30K.
That means, for GDP purposes, the two entries offset and the import has no net effect on GDP. If, however, we had predetermined that we were going to hit a certain level of consumption, then a shift from domestic production to imports would affect GDP.
For those tracking GDP, they often do form an idea of consumption separately from their idea of trade flows. Thus, news about trade deficits (Net Exports) tends to alter views on what GDP will be. It may seem a minor point, but the misattribution of causality can promote unwarranted protectionism.

Flexport’s implied trade deficit estimate on a balance-of-payments, seasonally adjusted basis for May 2022 is $120 billion, with the figure expected to rise at least through September. For Q2’22 the deficit may rise to $352 billion from $337 billion in Q1’22.
In conclusion: Flexport’s data can provide a higher accuracy forecast for U.S. international trade than traditional economic models. Our initial forecast shows growth of 3.7% for imports in May 2022 versus April, while exports are expected to dip by 1.2% on a balance-of-payments, seasonally-adjusted basis.
Disclaimer: The contents of this report are made available for informational purposes only and should not be relied upon for any legal, business, or financial decisions. Flexport does not guarantee, represent, or warrant any of the contents of this report because they are based on our current beliefs, expectations, and assumptions, about which there can be no assurance due to various anticipated and unanticipated events that may occur. This report has been prepared to the best of our knowledge and research; however, the information presented herein may not reflect the most current regulatory or industry developments. Neither Flexport nor its advisors or affiliates shall be liable for any losses that arise in any way due to the reliance on the contents contained in this report.
About the Author


