

December 18, 2023
Post-Covid Indicators
Post-Covid Indicators
December 18, 2023
Consumer Goods Preferences: Non-durables demand approaching pre-Covid levels
Flexport’s Post-Covid Indicator (PCI) measures the balance between U.S. consumers’ spending on goods versus services. Our update, which builds on the latest data release for October, forecasts the overall PCI to remain in the 70s from November through January, the current forecast period. Non-durables preferences are predicted to rise slightly to the high 20’s and remain above pre-Covid levels (a reading of 0) while durables will stay above the summer 2020 levels (reading of 100) as we finish the holiday season, reaching a value of 113 in January.
Covid-19 triggered a boom in goods demand, but how long will it last? We analyze exclusive shipping data to peek into the future. The monthly Flexport Post-Covid Indicator shows how demand could shift in the coming months.
The Methodology: The Flexport Post-Covid Indicator is based on an analysis of correlations between detailed shipping data and national consumption behavior. As one would expect, given how goods move, the closest correlations are between shipping flows in a month and consumption a bit later. Using the estimated model, we can look at more recent shipping data and forecast the consumption patterns that are likely to follow. See our report “Understanding the Post-Covid Indicator” for more details.
Update December 18, 2023: The pressure on global supply chains, which has eased but not yet reverted to pre-pandemic norms, was the result of several factors in combination: strong incomes, a willingness to spend rather than save, and a heightened preference for goods in consumption. Flexport’s Post-Covid Indicator tracks the last of these.
The PCI compares the balance of spending in summer 2020 (PCI = 100) to that before the pandemic (PCI = zero). It peaked at over 150 in April 2021.
Fig. 1 Consumption Patterns Stay Far Above Pre-Covid Norms
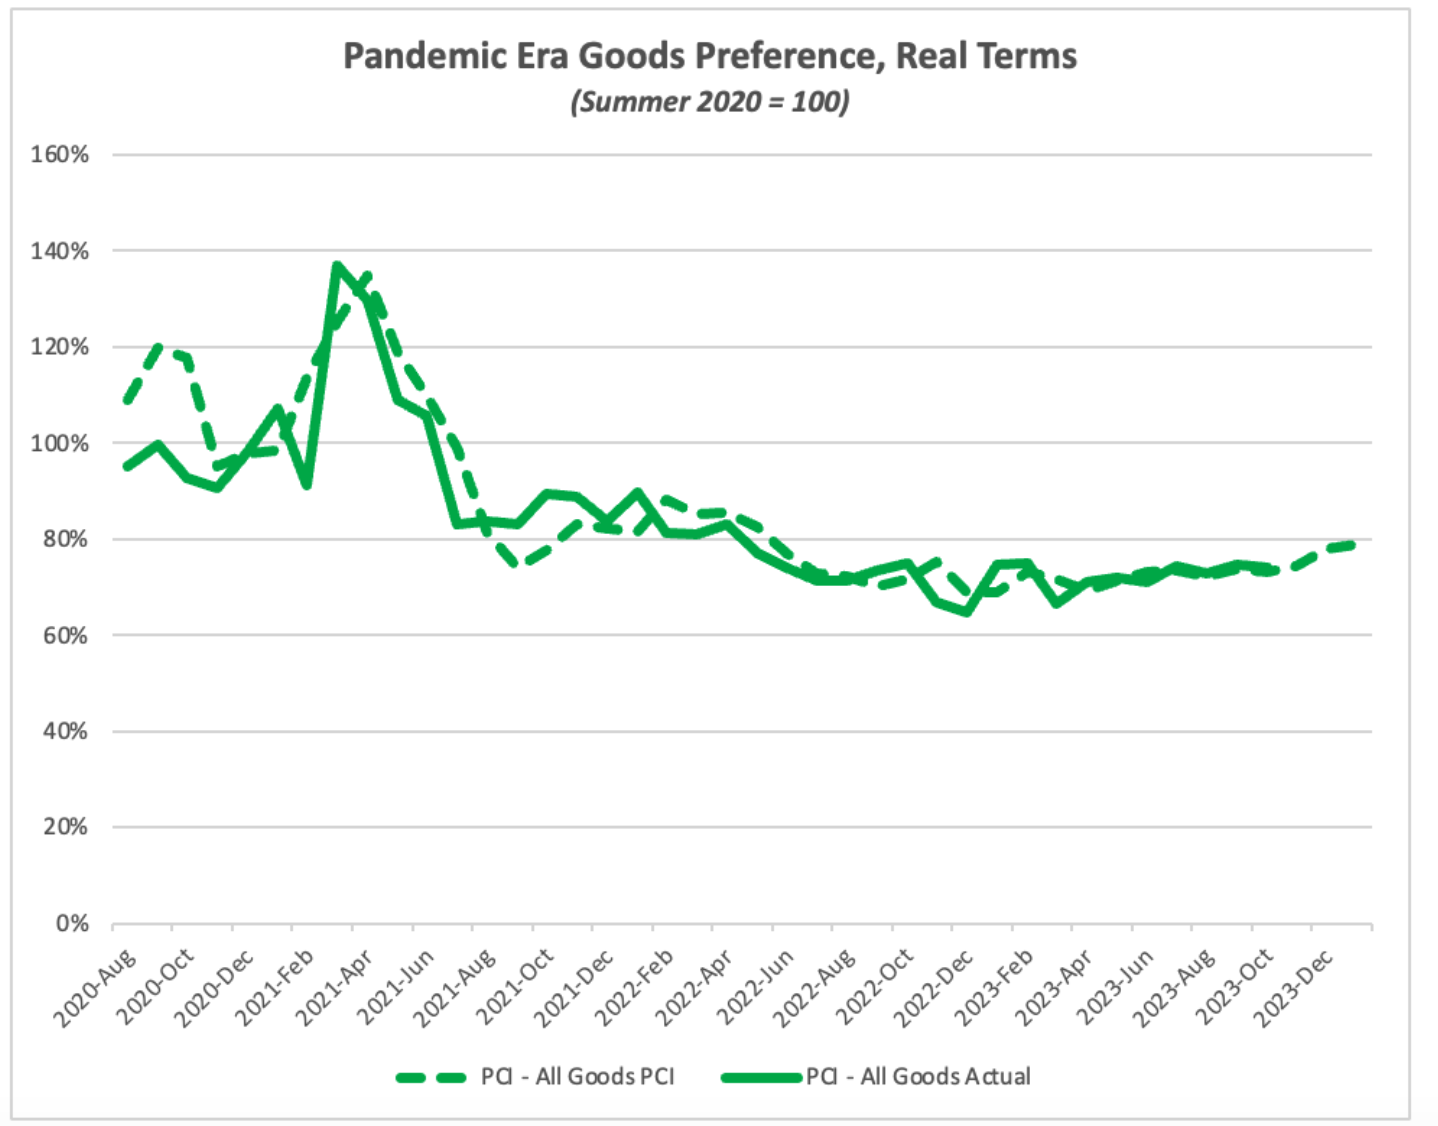
The latest data for the PCI show that consumer preferences for goods remained high in November at 73. We forecast current levels of goods preference to increase through January of 2024 to 79. These are below Summer 2020 levels but still well above pre-pandemic levels.
Fig. 2 Durables Preference Strong and Getting Stronger
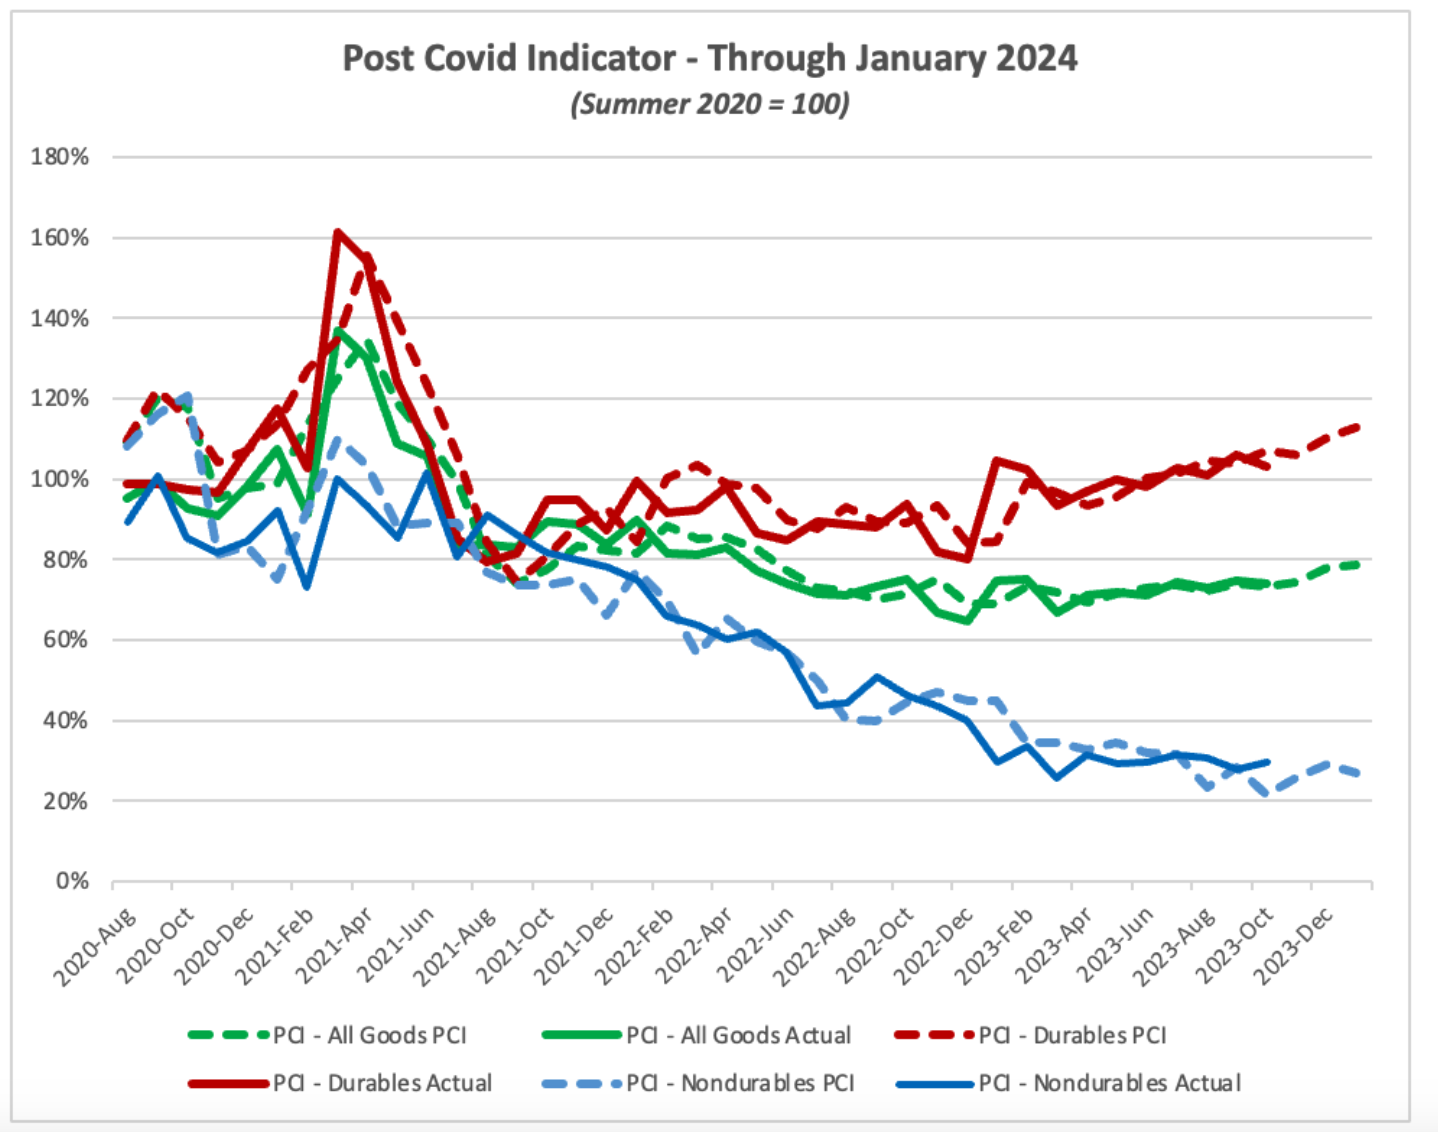
Figure 2 breaks down goods preferences into the two major subcategories: durable goods, which are meant to last three years or more, and nondurable goods. One of the real puzzles of the pandemic-era economy has been the enduring strength of demand for durable goods, which we are forecasting to remain above their summer 2020 levels and ascend from November through January. So the puzzle persists.
The Post Covid Indicator, which measures the relative demand for goods over services relative to Pre-Covid levels, remains high through the first month of 2024. Although the PCI for Nondurables has been decreasing, it is now forecast to be slightly higher over the next few months, pulling up short from a return to pre-Covid norms The PCI for Goods in general is forecast to start drifting upwards while the PCI for Durables is forecast to increase by 10 points. If the relative shares of goods is going to return to pre-Covid levels, there are no strong signs of it yet.
See our PCI Primer for more details. Please direct questions about the Flexport PCI to economics@flexport.com.
Disclaimer: The contents of this report are made available for informational purposes only and should not be relied upon for any legal, business, or financial decisions. Flexport does not guarantee, represent, or warrant any of the contents of this report because they are based on our current beliefs, expectations, and assumptions, about which there can be no assurance due to various anticipated and unanticipated events that may occur. This report has been prepared to the best of our knowledge and research; however, the information presented herein may not reflect the most current regulatory or industry developments. Neither Flexport nor its advisors or affiliates shall be liable for any losses that arise in any way due to the reliance on the contents contained in this report.
Flexport Indicators
| Indicator | Published | Details |
|---|---|---|
| Air Timeliness Indicator | Weekly | Learn More |
| Ocean Timeliness Indicator | Weekly | Learn More |
| Flexport Consumption Forecast | Monthly | Learn More |
| Trade Activity Forecast | Monthly | Learn More |
| Post-Covid Indicator | Monthly | Learn More |
| Southeast Asia Sectoral Cost Indices | Quarterly | Learn More |
About the Author
December 18, 2023


