

June 17, 2022
Accidents and Precedents - Corporate Inventories Soar

Accidents and Precedents - Corporate Inventories Soar

What’s the right level of corporate inventory? Have specific industries already overbuilt their stocks versus requirements? This report gathers over a decade of data on corporate inventory to sales ratios from over 1,400 companies. We find that inventories in Q1’22 rose 13% year over year while sales went up just 6%. There are at least seven different reasons for that disparity, ranging from deliberate strategies to accidental outcomes. The result is that the inventory to sales ratio is back to pre-pandemic levels across the group and five of eight sectors are already well above historic levels.
The rapid rise of consumer price inflation has started to have an impact on consumer spending. At the same time delays in inventory arrivals, discussed in prior Flexport research, has led to corporate concerns regarding excessive inventory levels.
Indeed, that’s already led one major retailer in the U.S. to launch an inventory liquidation strategy and another to start subletting its warehousing space. The latter is notable in the context of elevated warehouse occupancy levels and rates.
Inventories - The New, Old Supply Chain Worry
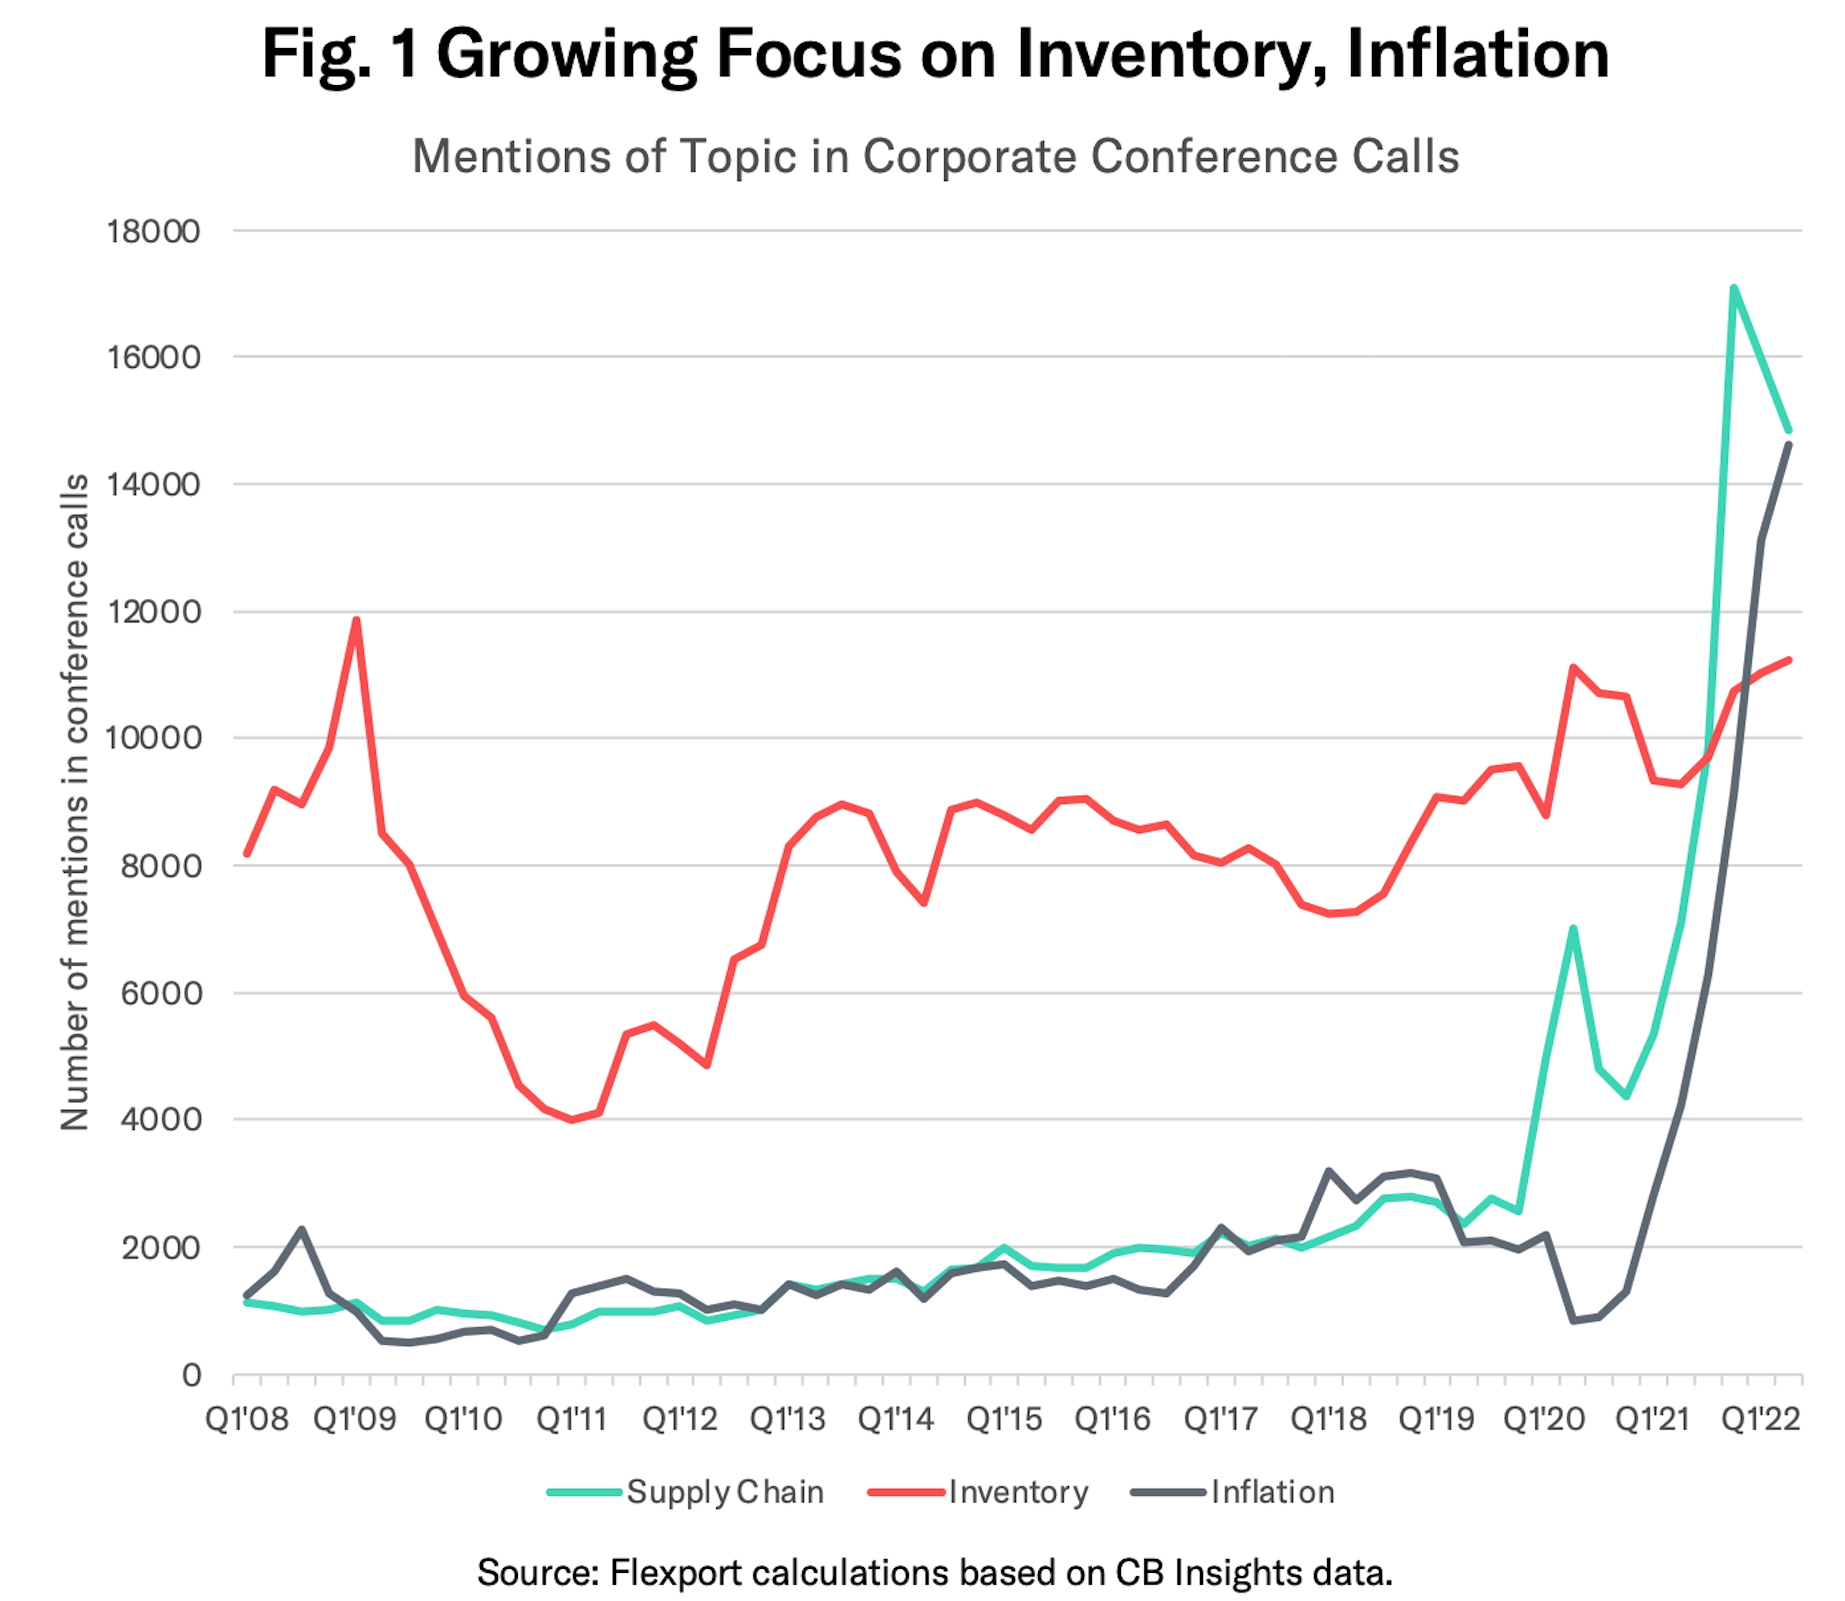
Flexport’s analysis of corporate earnings conference call transcripts (via CB Insights) shows a resurgence in concerns about inventories recently, with 21% more mentions in Q2'22 than there were in Q2’21 as shown in Figure 1.
That’s come as mentions of inflation have increased by 248% over the same period to reach their highest since at least 2008. Discussions of “supply chains” meanwhile surged in Q4’21 and were 109% higher in Q2’22 than Q2’21.
Manufacturing surveys show that inventory balances are also recovering. Eurostat’s measure of stocks of finished goods in the European Union were below long-term average in April but already back to their highest since February 2021. The U.S. ISM inventory survey reading of 55.9 (where above 50 indicates expansion) in May marked a recovery from 51.7 in April and was the highest since November 2021.
The value of U.S. wholesale inventories increased by 2.2% in April, a faster rate than expected by economists, and is now 24.0% above the same time last year. The resulting inventory to sales ratio—which to a certain extent controls for inflation over time—reached 1.25x in April, the highest since July 2020.
Tracking Corporate Inventories via Financial Data
The level of granularity available from macroeconomic data can be unsatisfactory. Corporate financial data meanwhile can provide a wider scope of coverage geographically and allows customization to alternative industry reporting structures.
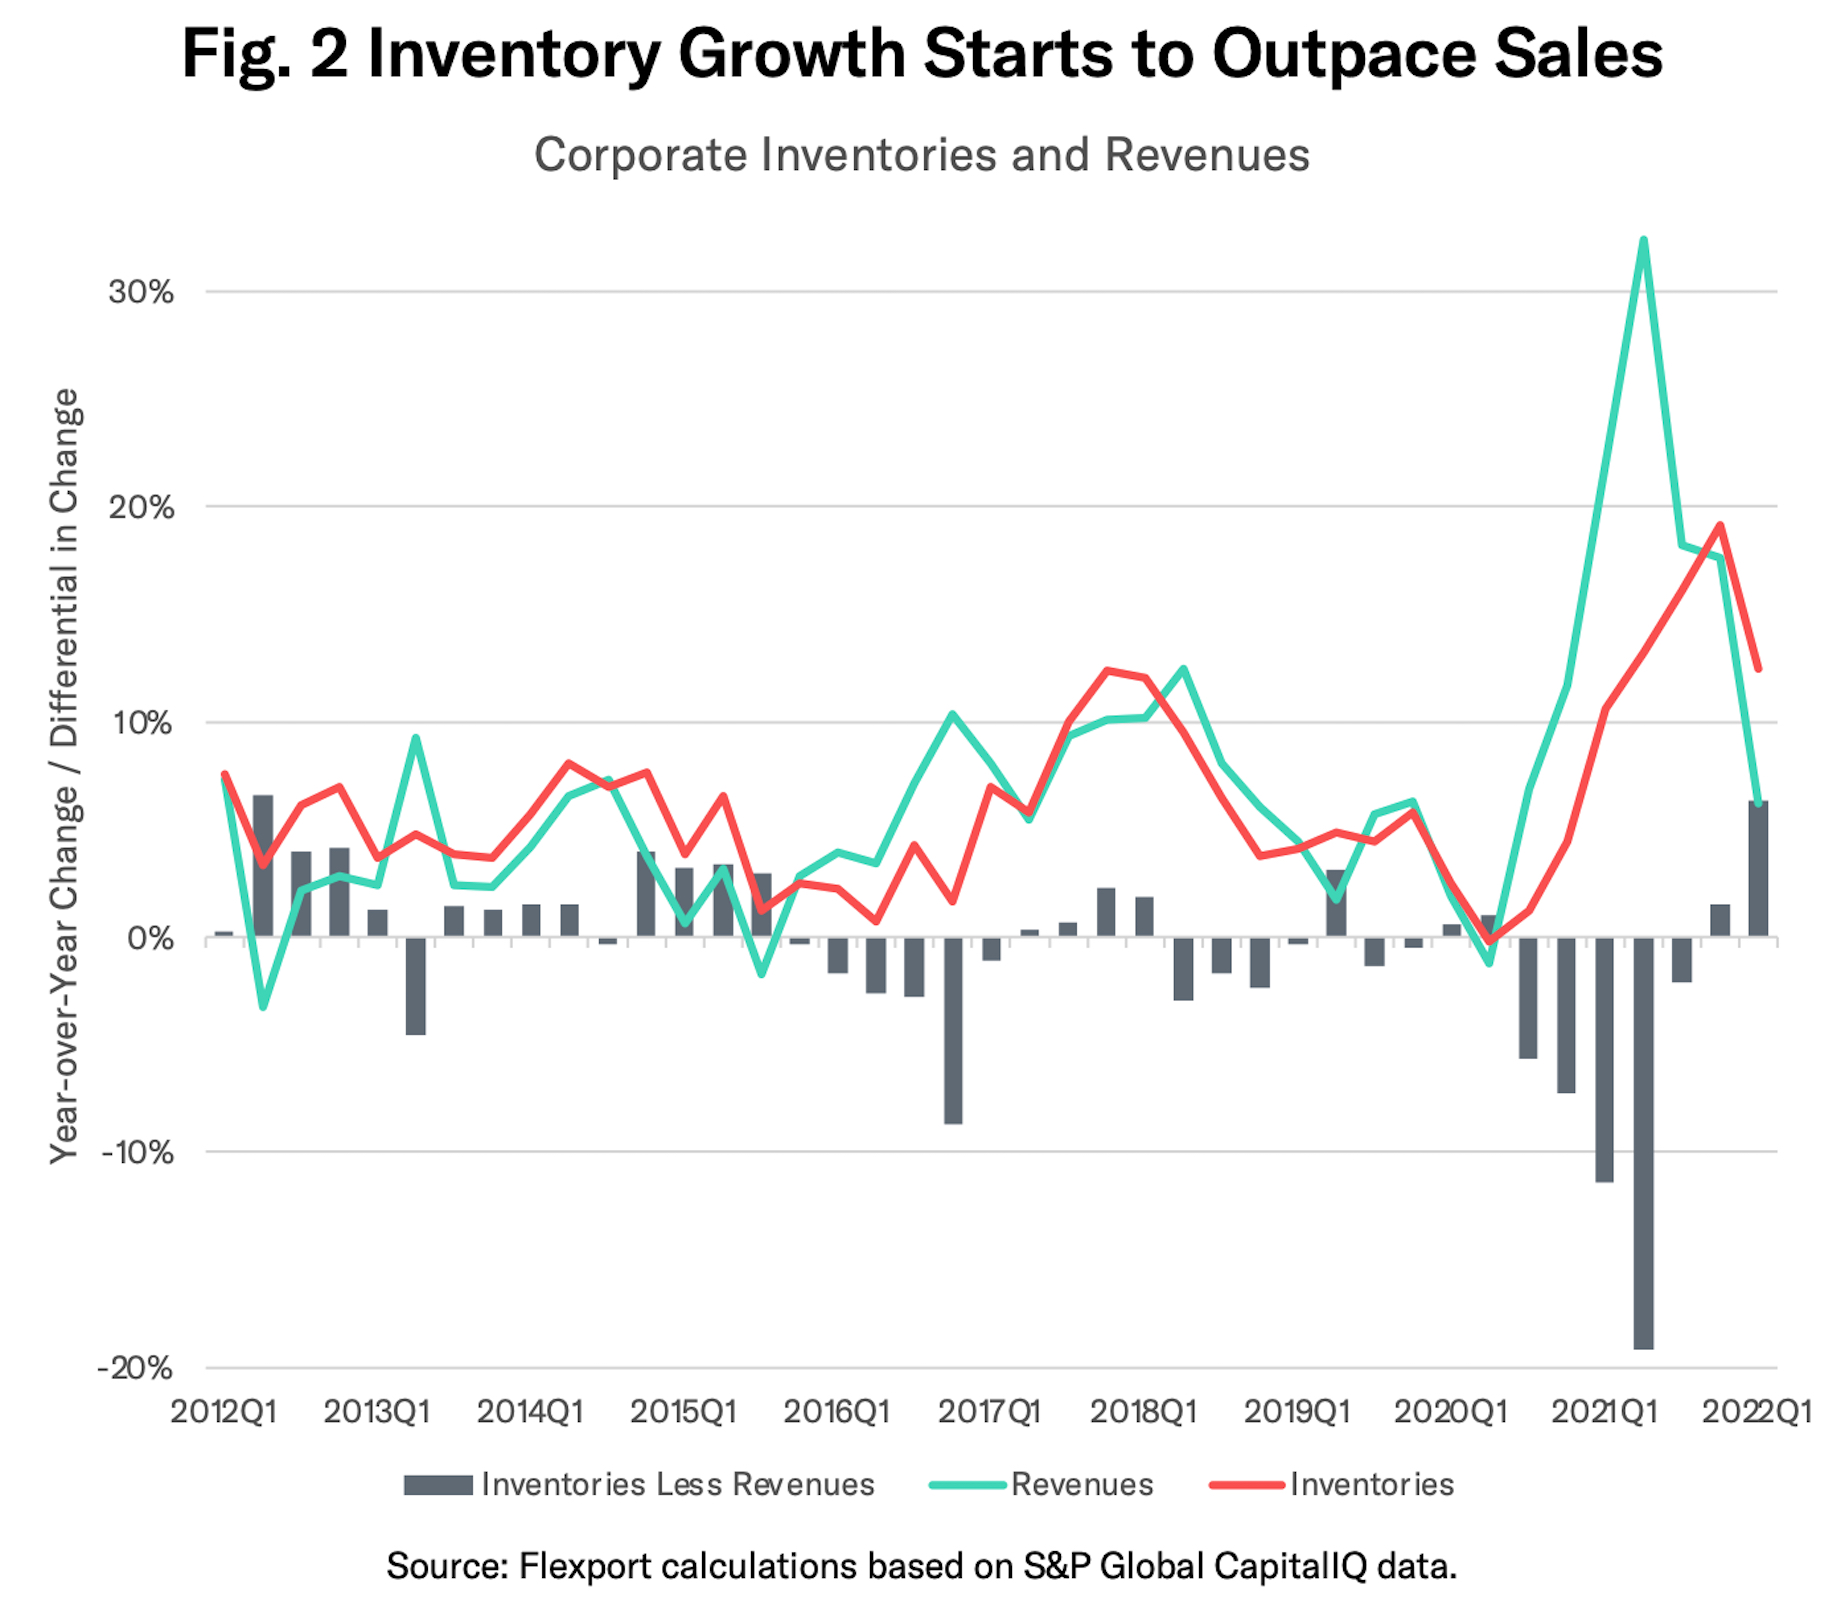
Flexport’s analysis of the financial data for 1,400 companies quoted on the NYSE and NASDAQ shows inventories for the group increased by 12.5% year over year in Q1’22 while revenues rose by just 6.2%. As shown in Figure 2 above, inventory growth had also outpaced revenue growth in Q4’21 after lagging since Q3’20.
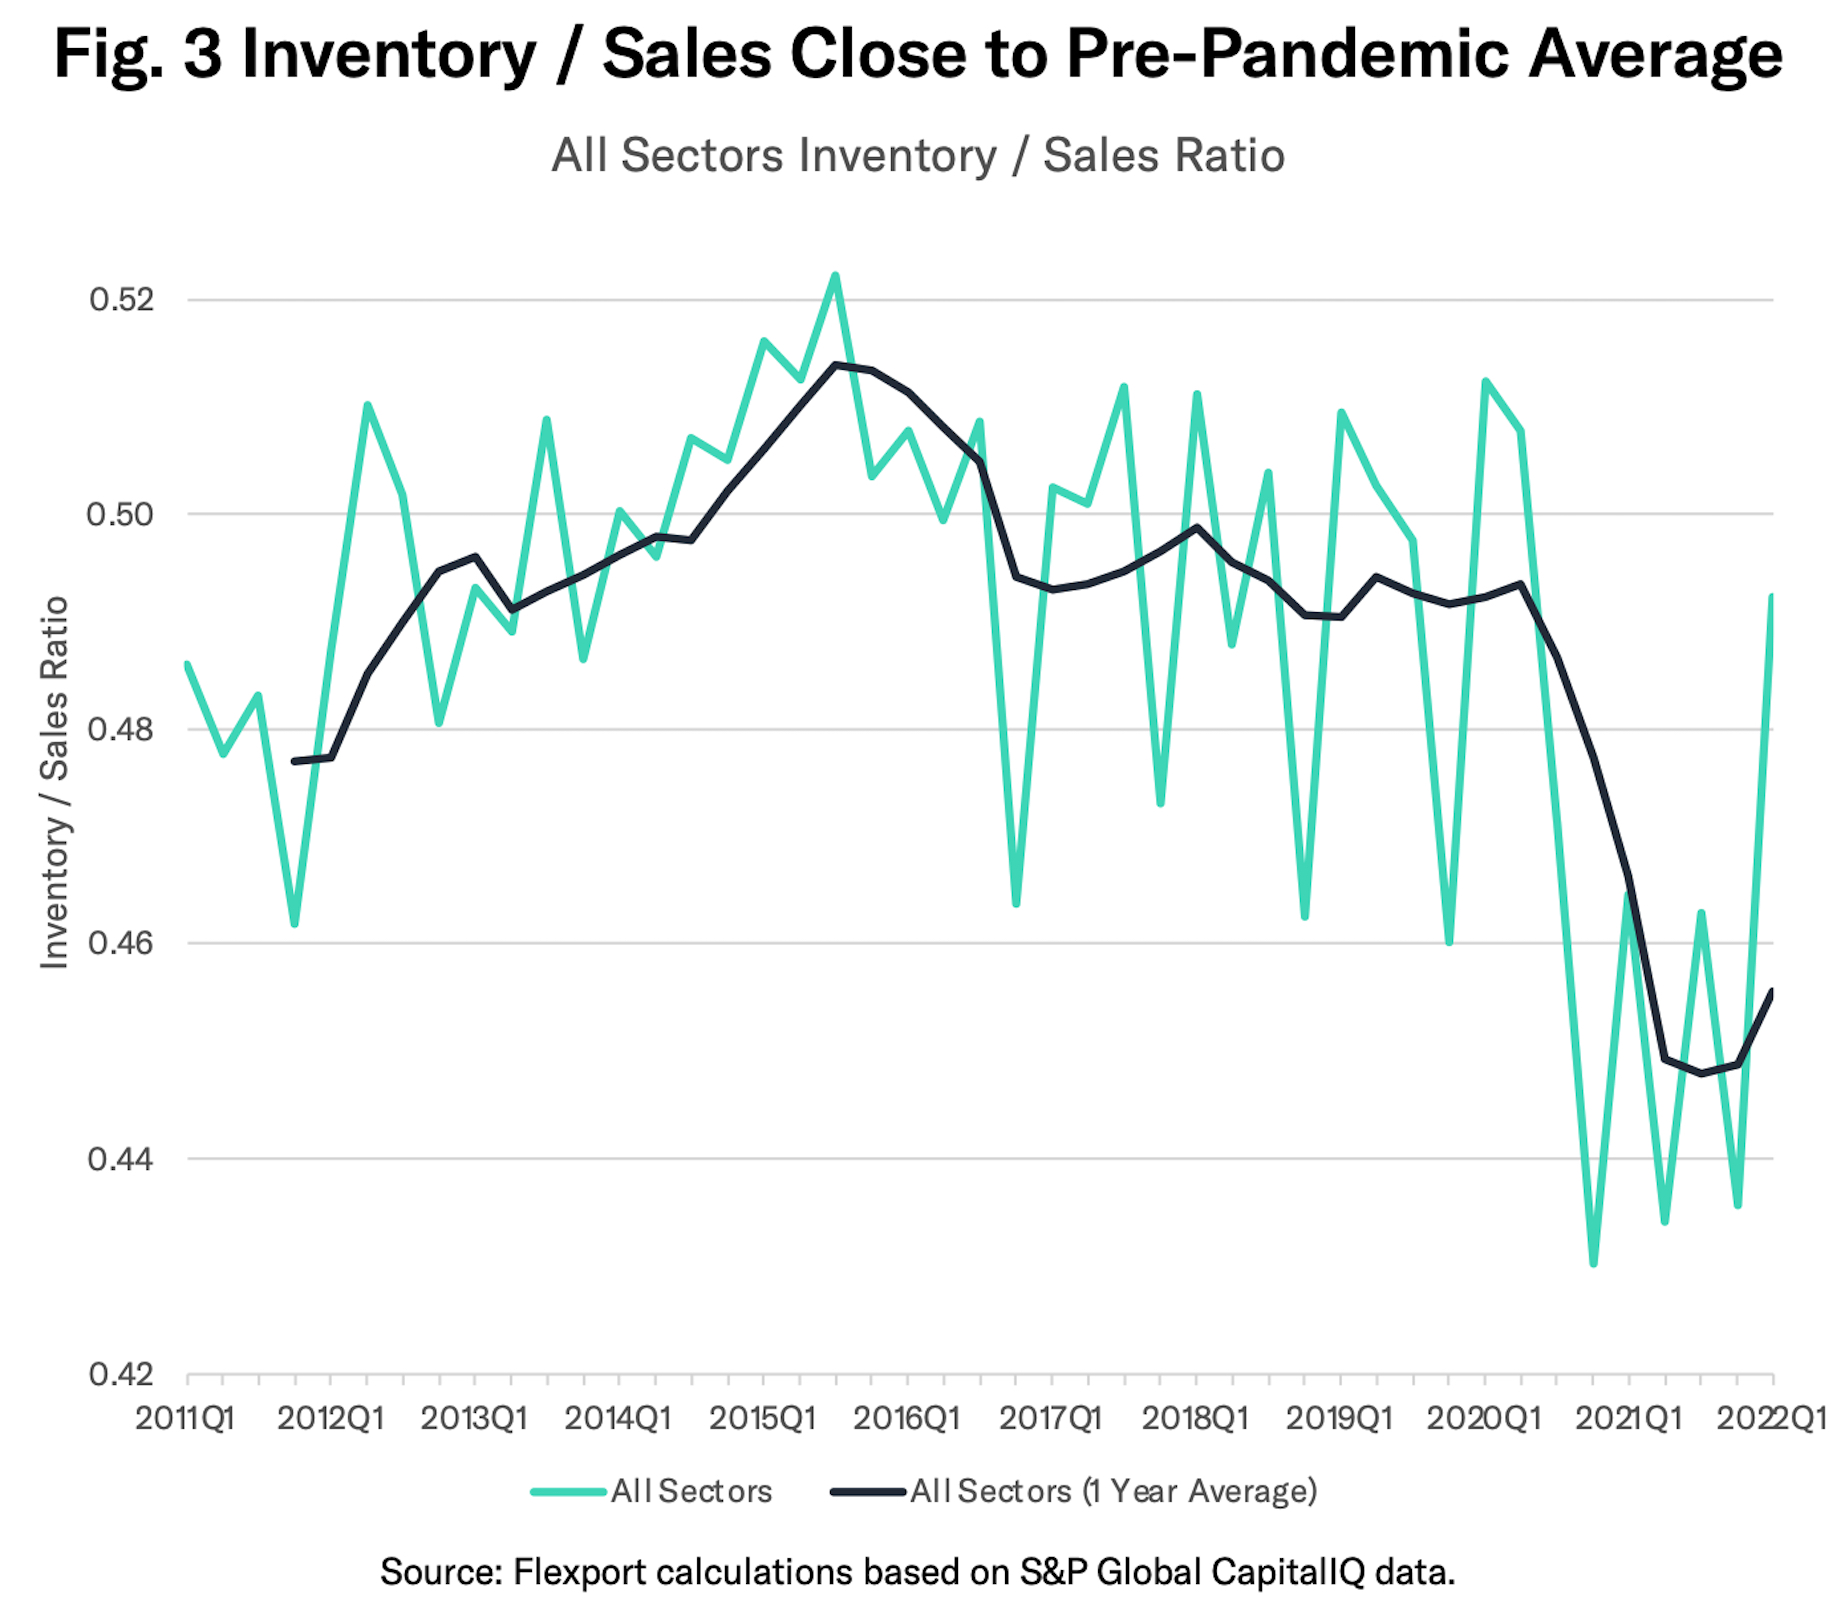
Returning to the inventory to sales ratio, the average for the 1,400 companies covered reached 0.49x in Q1’22 compared to 0.46x a year earlier and a trough of 0.44x in Q4’21.
Three longer-term points also emerge as shown in Figure 3 above:
- The increase in inventories has brought the inventory to sales ratio back near its pre-pandemic (2011 - 2019) average of 0.50x.
- From a seasonal perspective the ratio tends to peak in the third quarter each year, coinciding with the preparations for peak pre-holiday season in the North American and European markets.
- It’s not clear whether there’s a true long-term average. The ratio built up steadily from 2011, in the wake of the financial crisis, to 2015’s peak of 0.52x. The “mini-recession” of 2015/2016 appears to have opened a period of high volatility with a range of 0.46x to 0.50x in 2017 until the start of the pandemic.
It remains to be seen, therefore, whether the inventory to sales ratio will simply return to its 0.50x average or some higher (or lower) level. Corporate strategies in this regard will vary both by sector and within sectors.
Deliberate and Accidental Reasons for Inventory Build Up
Flexport’s review of over 70 firms’ earnings conference calls during the pandemic reveals at least seven major reasons for the build-up in the inventory to sales ratio in the past two quarters which can be split into deliberate choices and accidental outcomes.
Among the deliberate strategies, firms have chosen to:
- Rebuild inventories back to historic levels after an extended period of stock-outs.
- Ship products earlier than in prior years to offset the challenges still present in the logistics industry.
- Get ahead of continued increases in inflation in order to secure cheap products now to sell at higher prices later.
- Start implementing new inventory management strategies, typically by moving from lean just-in-time processes to more conservative, risk-based just-in-case approaches.
Others have suffered from poor choices or rapidly changing circumstances:
- Poor selection choices as demand patterns—both in terms of SKUs and timing during the year—have become less predictable during the pandemic.
- Over-estimation of sales growth, with 14% of the companies analyzed having experienced lower sales year over year and 27% having growth rates under 5%.
- Lack of individual components, particularly semiconductors, where an earlier over-reaction to the perceived shortfall in demand at the start of the pandemic led to the cancellation of long-term orders. Buyers of the component that did not cancel get priority from the suppliers.
Leisure and Electronics May Be Overbuilt Already
Progress on the build-up in inventories versus sales also varies markedly by industry.
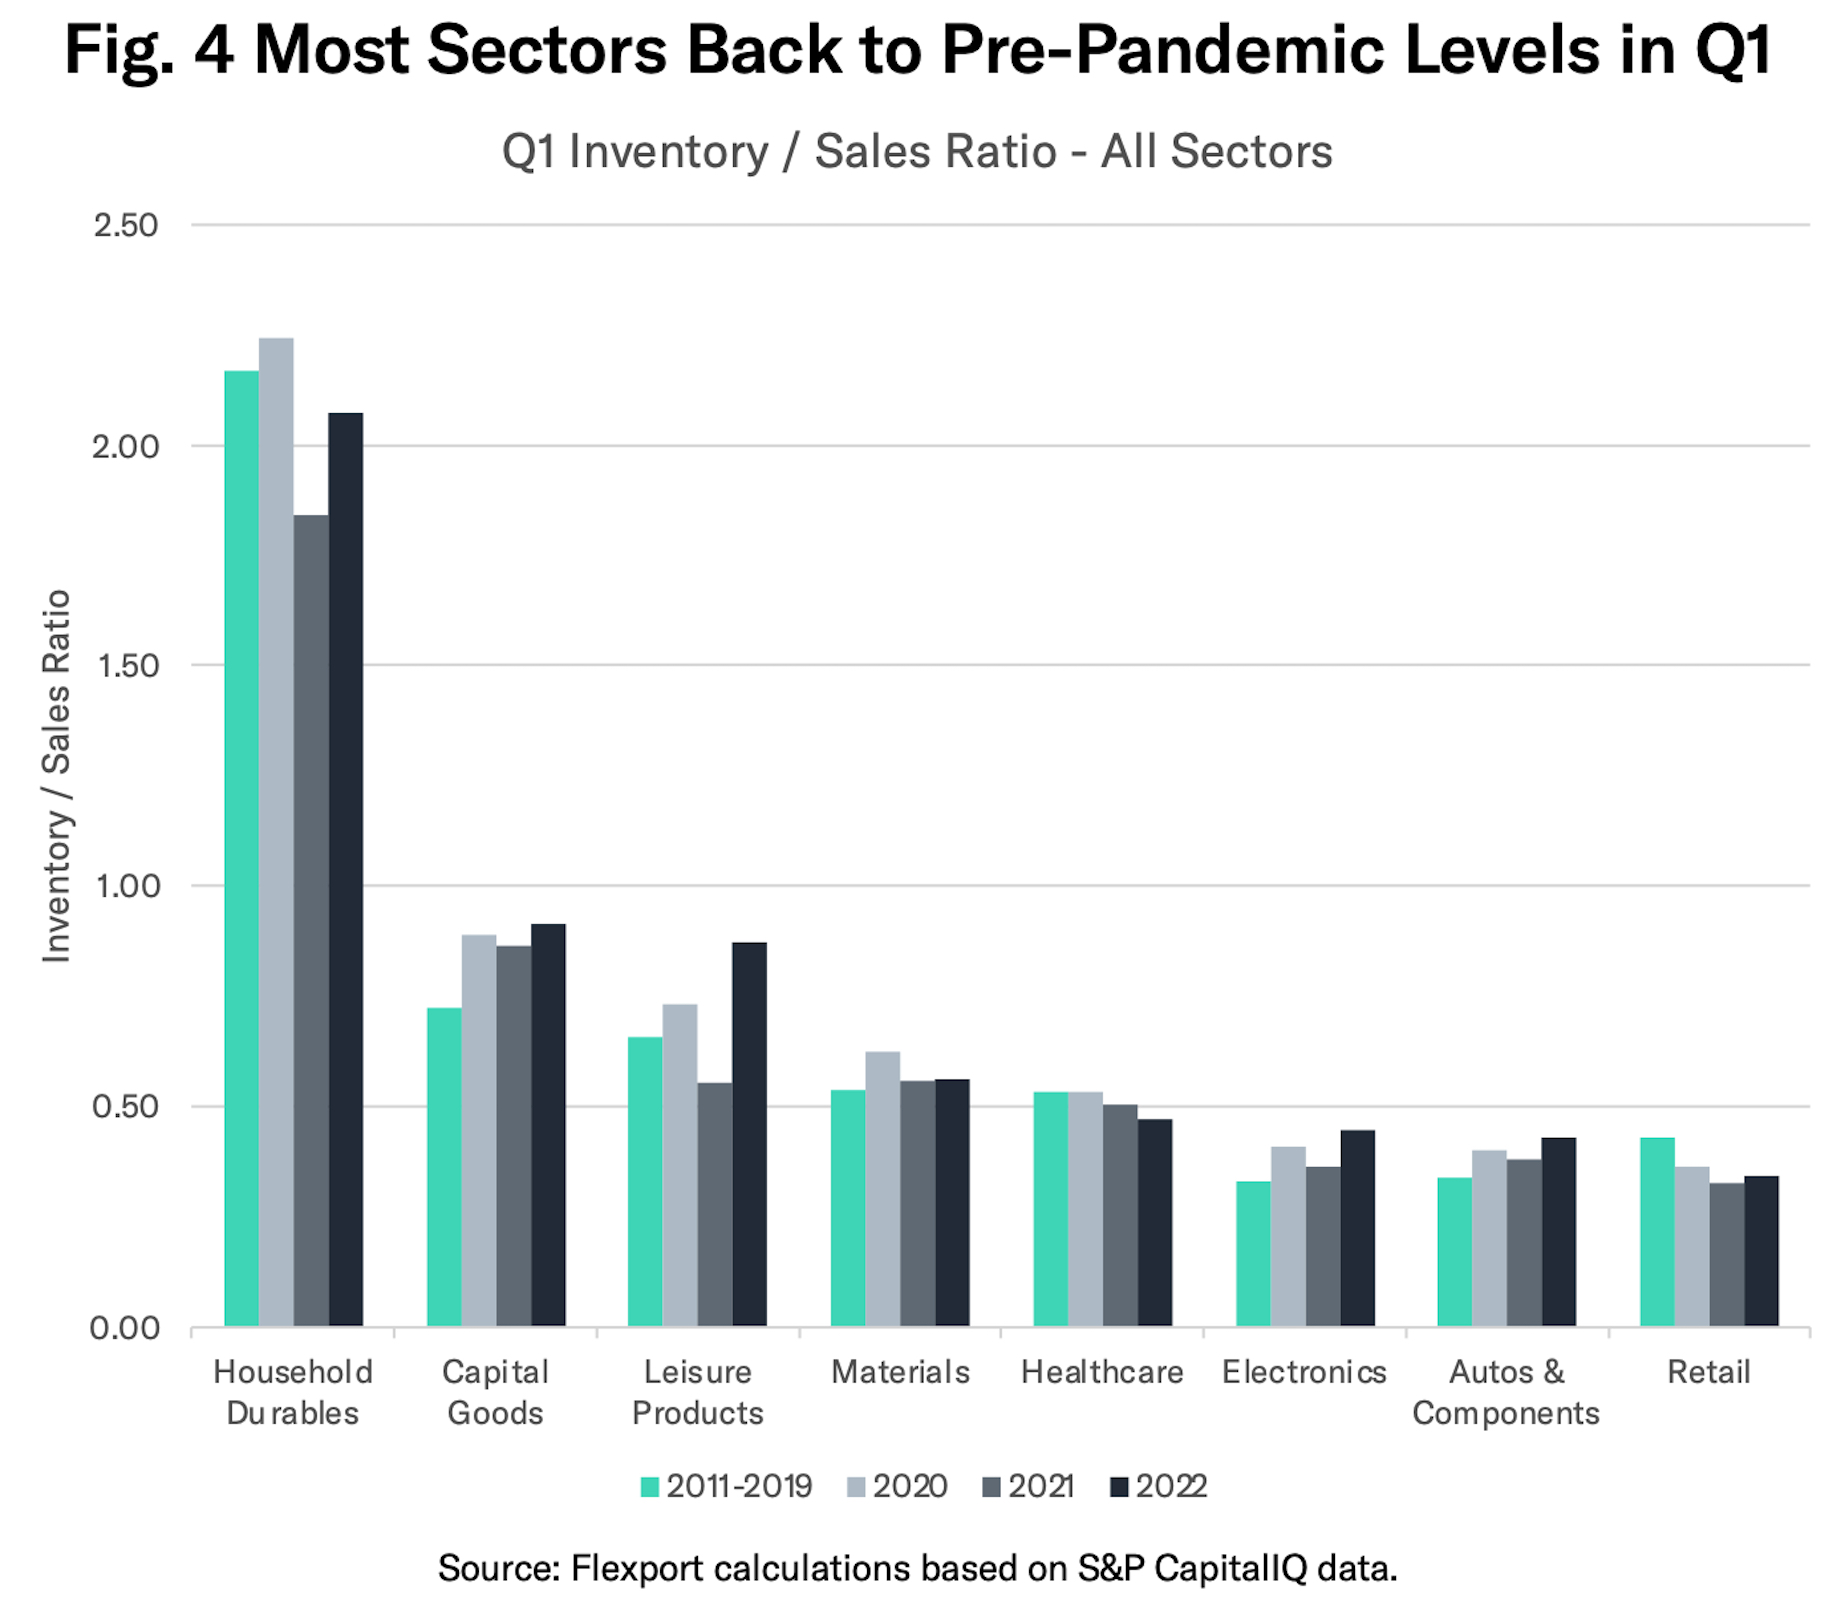
Figure 4 shows that five of the eight major sectors tracked by Flexport already had an inventory to sales ratio in Q1’22 that was above the average for Q1 in the 2011-2019 period. In the case of leisure products (e.g. toys, outdoor and fitness equipment) and electronics (computing, telecoms and components) ratios were already 25% higher than the pre-pandemic period.
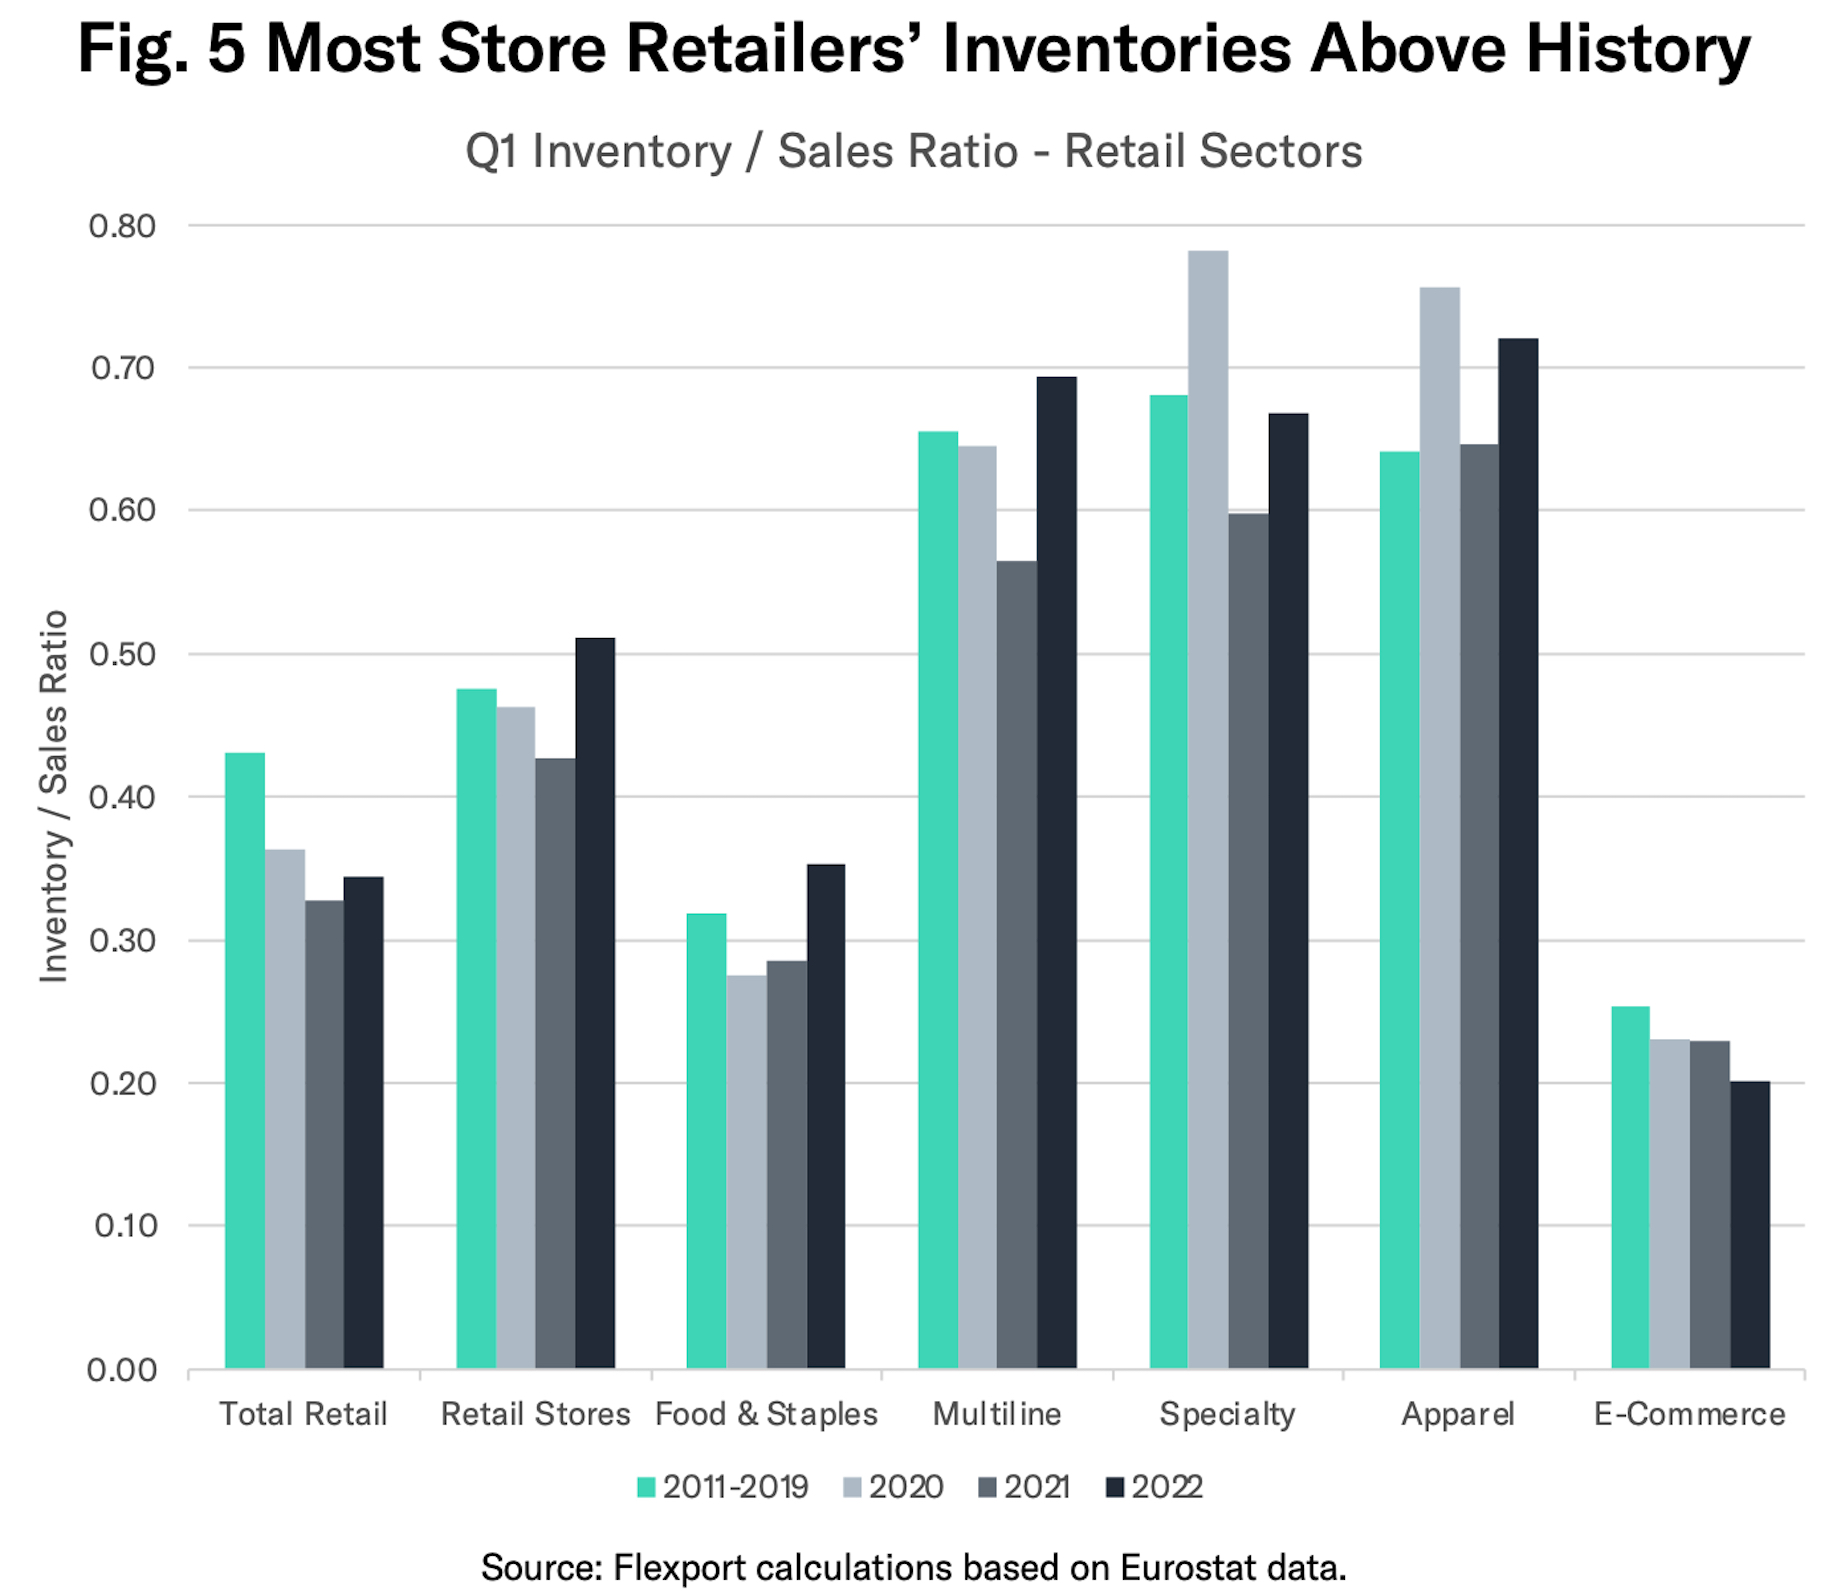
The sectors where inventory to sales ratios are still well below the pre-pandemic average include healthcare and retail. The former has been disrupted by the pandemic itself. For the retail sector there is a marked spread between store and non-store (i.e., e-commerce retailers).
For ecommerce specifically the inventory to sales ratio of 0.20x remains well below the 0.25x pre-pandemic levels. Shifting business practices, discussed in Flexport’s recent research on the warehouse sector, suggests a return to high levels may not be on the cards.
For physical retailers the picture is very different, with apparel and food stores already well above pre-pandemic levels while multiline and specialty retailers are within striking distance of historic norms.
In conclusion: Inventory balances and the impact of inflation on sales are a major preoccupation for corporations. Inventories among 1,400 public companies increased by 12.5% year over year in Q1’22 while sales only rose by 6.2% for a mixture of active and passive decision-making reasons. That left inventory to sales at 0.49x, close to the pre-pandemic level of 0.5x with five of the big eight sectors already well above pre-pandemic levels.
Disclaimer: The contents of this report are made available for informational purposes only and should not be relied upon for any legal, business, or financial decisions. Flexport does not guarantee, represent, or warrant any of the contents of this report because they are based on our current beliefs, expectations, and assumptions, about which there can be no assurance due to various anticipated and unanticipated events that may occur. This report has been prepared to the best of our knowledge and research; however, the information presented herein may not reflect the most current regulatory or industry developments. Neither Flexport nor its advisors or affiliates shall be liable for any losses that arise in any way due to the reliance on the contents contained in this report.
About the Author


