

September 12, 2022
Pack It In - Corporate Inventory Challenges


Have corporate inventories gotten out of control? Have all industries seen similar trends? What are firms doing to manage the inventory aspects of their supply chains? This report finds that, in the aggregate, corporate inventories have rapidly moved from being inadequate to being at, or even above, pre-pandemic levels. Electronics, consumer durables and leisure products are well above historic inventory levels. There are several reasons why inventories have risen, such as demand forecasting mistakes and strategies to avoid inflation. Companies are deploying a wide range of inventory-reduction tactics, ranging from discounting to pack-and-hold practices, into their supply chains.
In this report we’ll look at two pieces of evidence for the state of inventories within supply chains. First, we’ll consider corporate financial data for companies quoted on North American stock exchanges. Second, we’ll compare the situation in the EU and U.S. using two distinct forms of macroeconomic data. We’ll then look at corporate motivations using earnings call transcript data for a wide range of North American, European and Asian companies.
Back to Historic Levels - Corporate Inventories Rebound
Corporate inventories, among North American quoted firms, have rapidly shifted from being understocked to being fully built within just a few months. Some sectors now appear over-stocked.
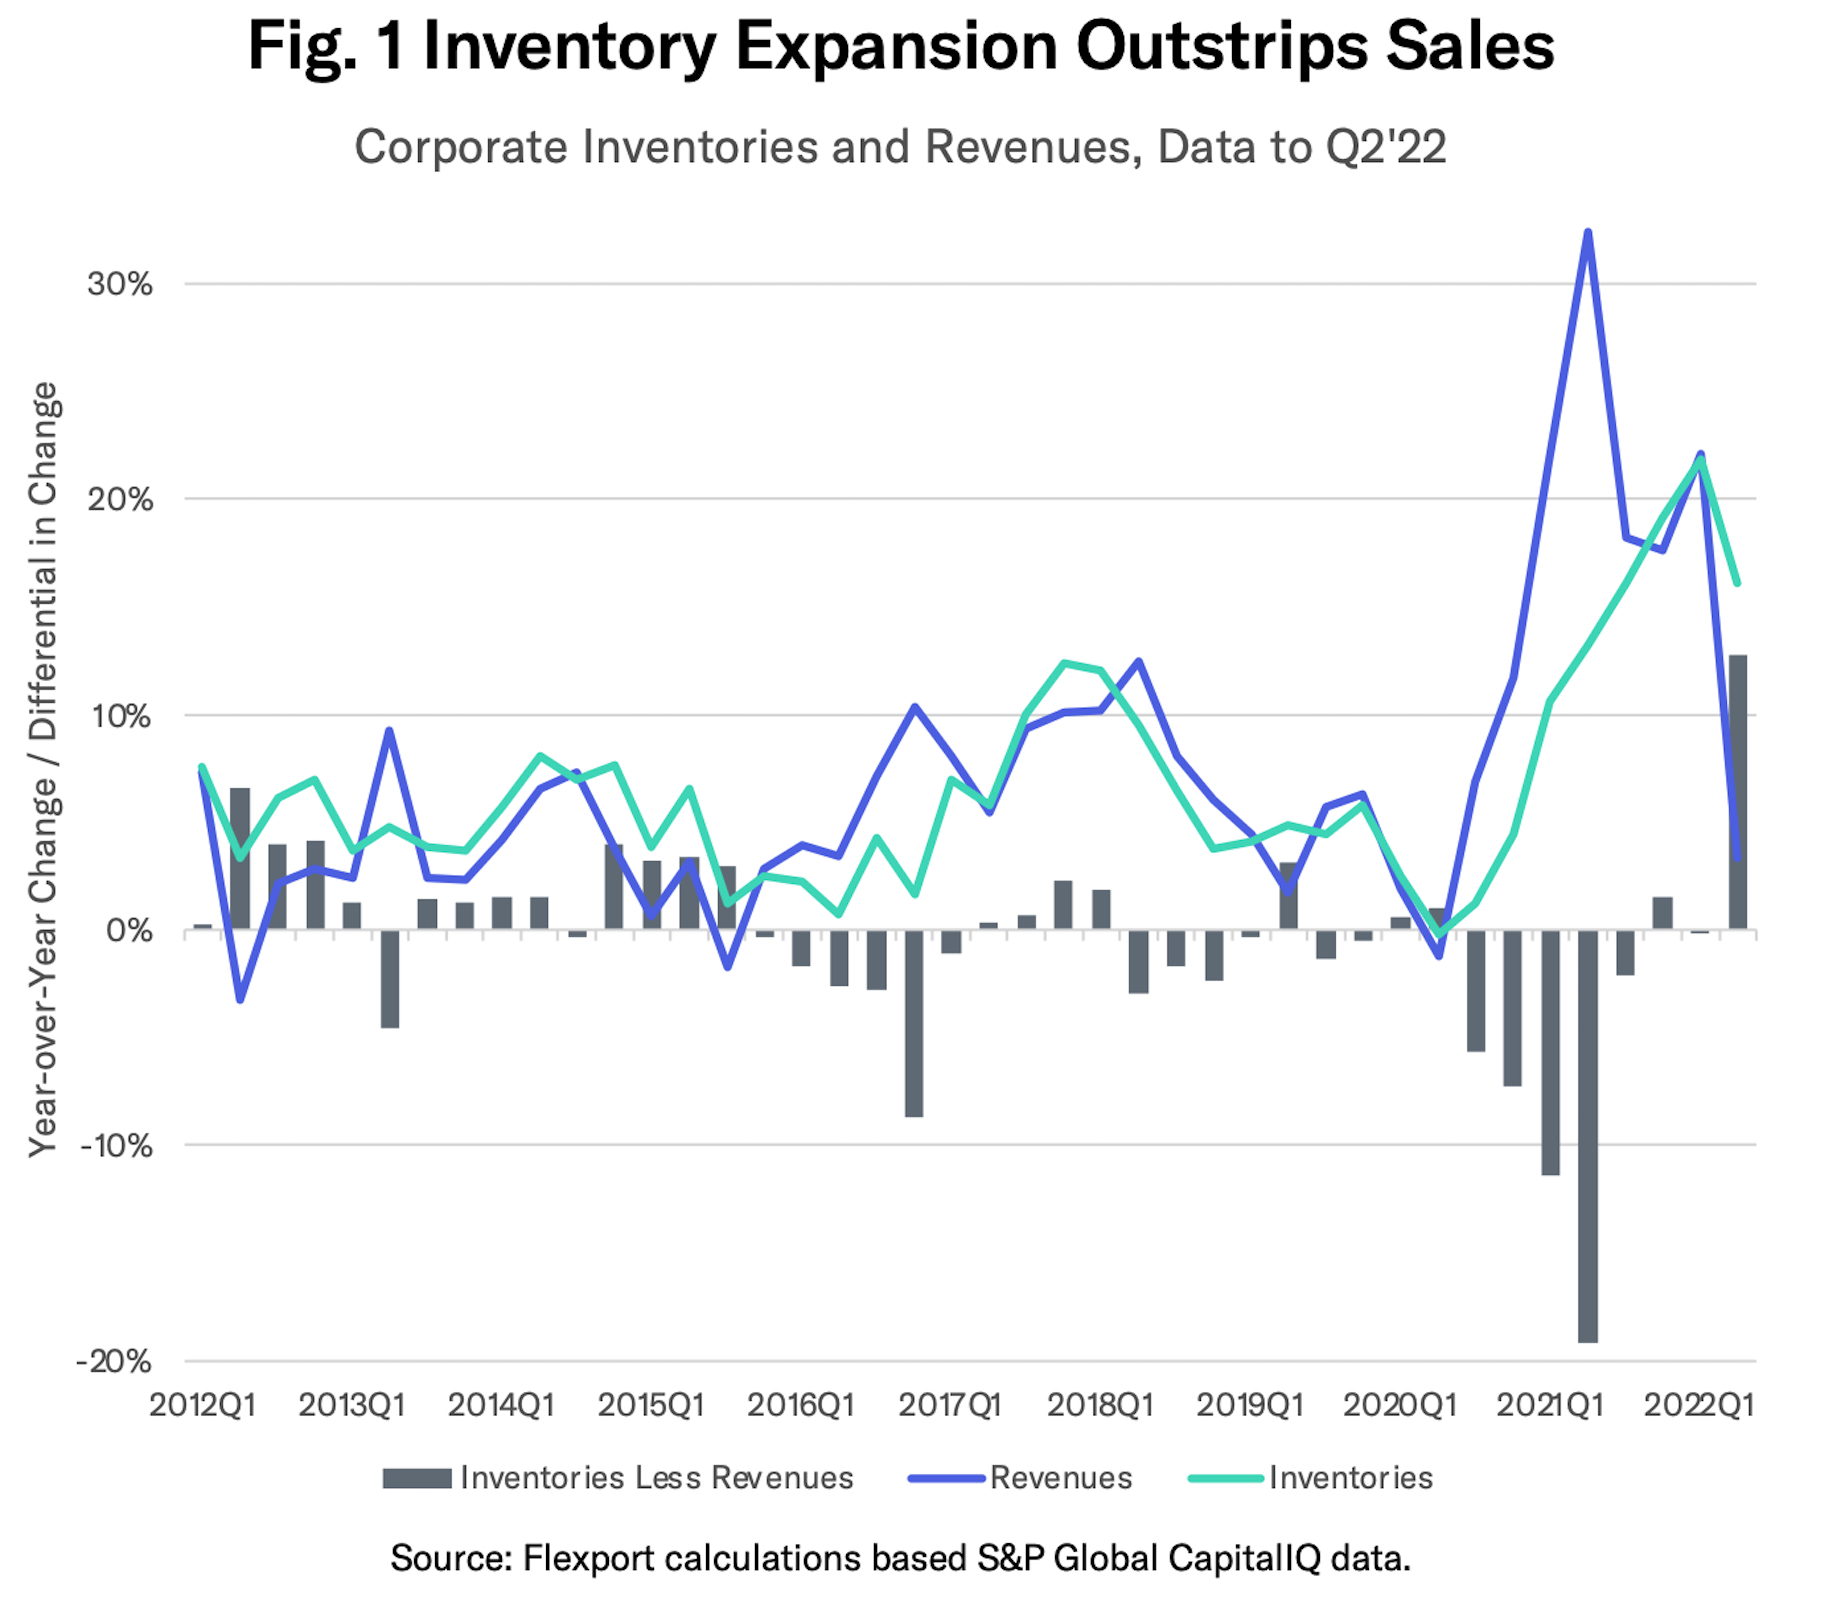
Flexport’s analysis of financial statements for over 1,500 companies shows inventories climbed by 16% year over year in Q2’22 while revenues increased by just 3.4%. The resulting 12.7% point gap was the widest positive gap since at least 2012, as shown by the gray bars in Figure 1.
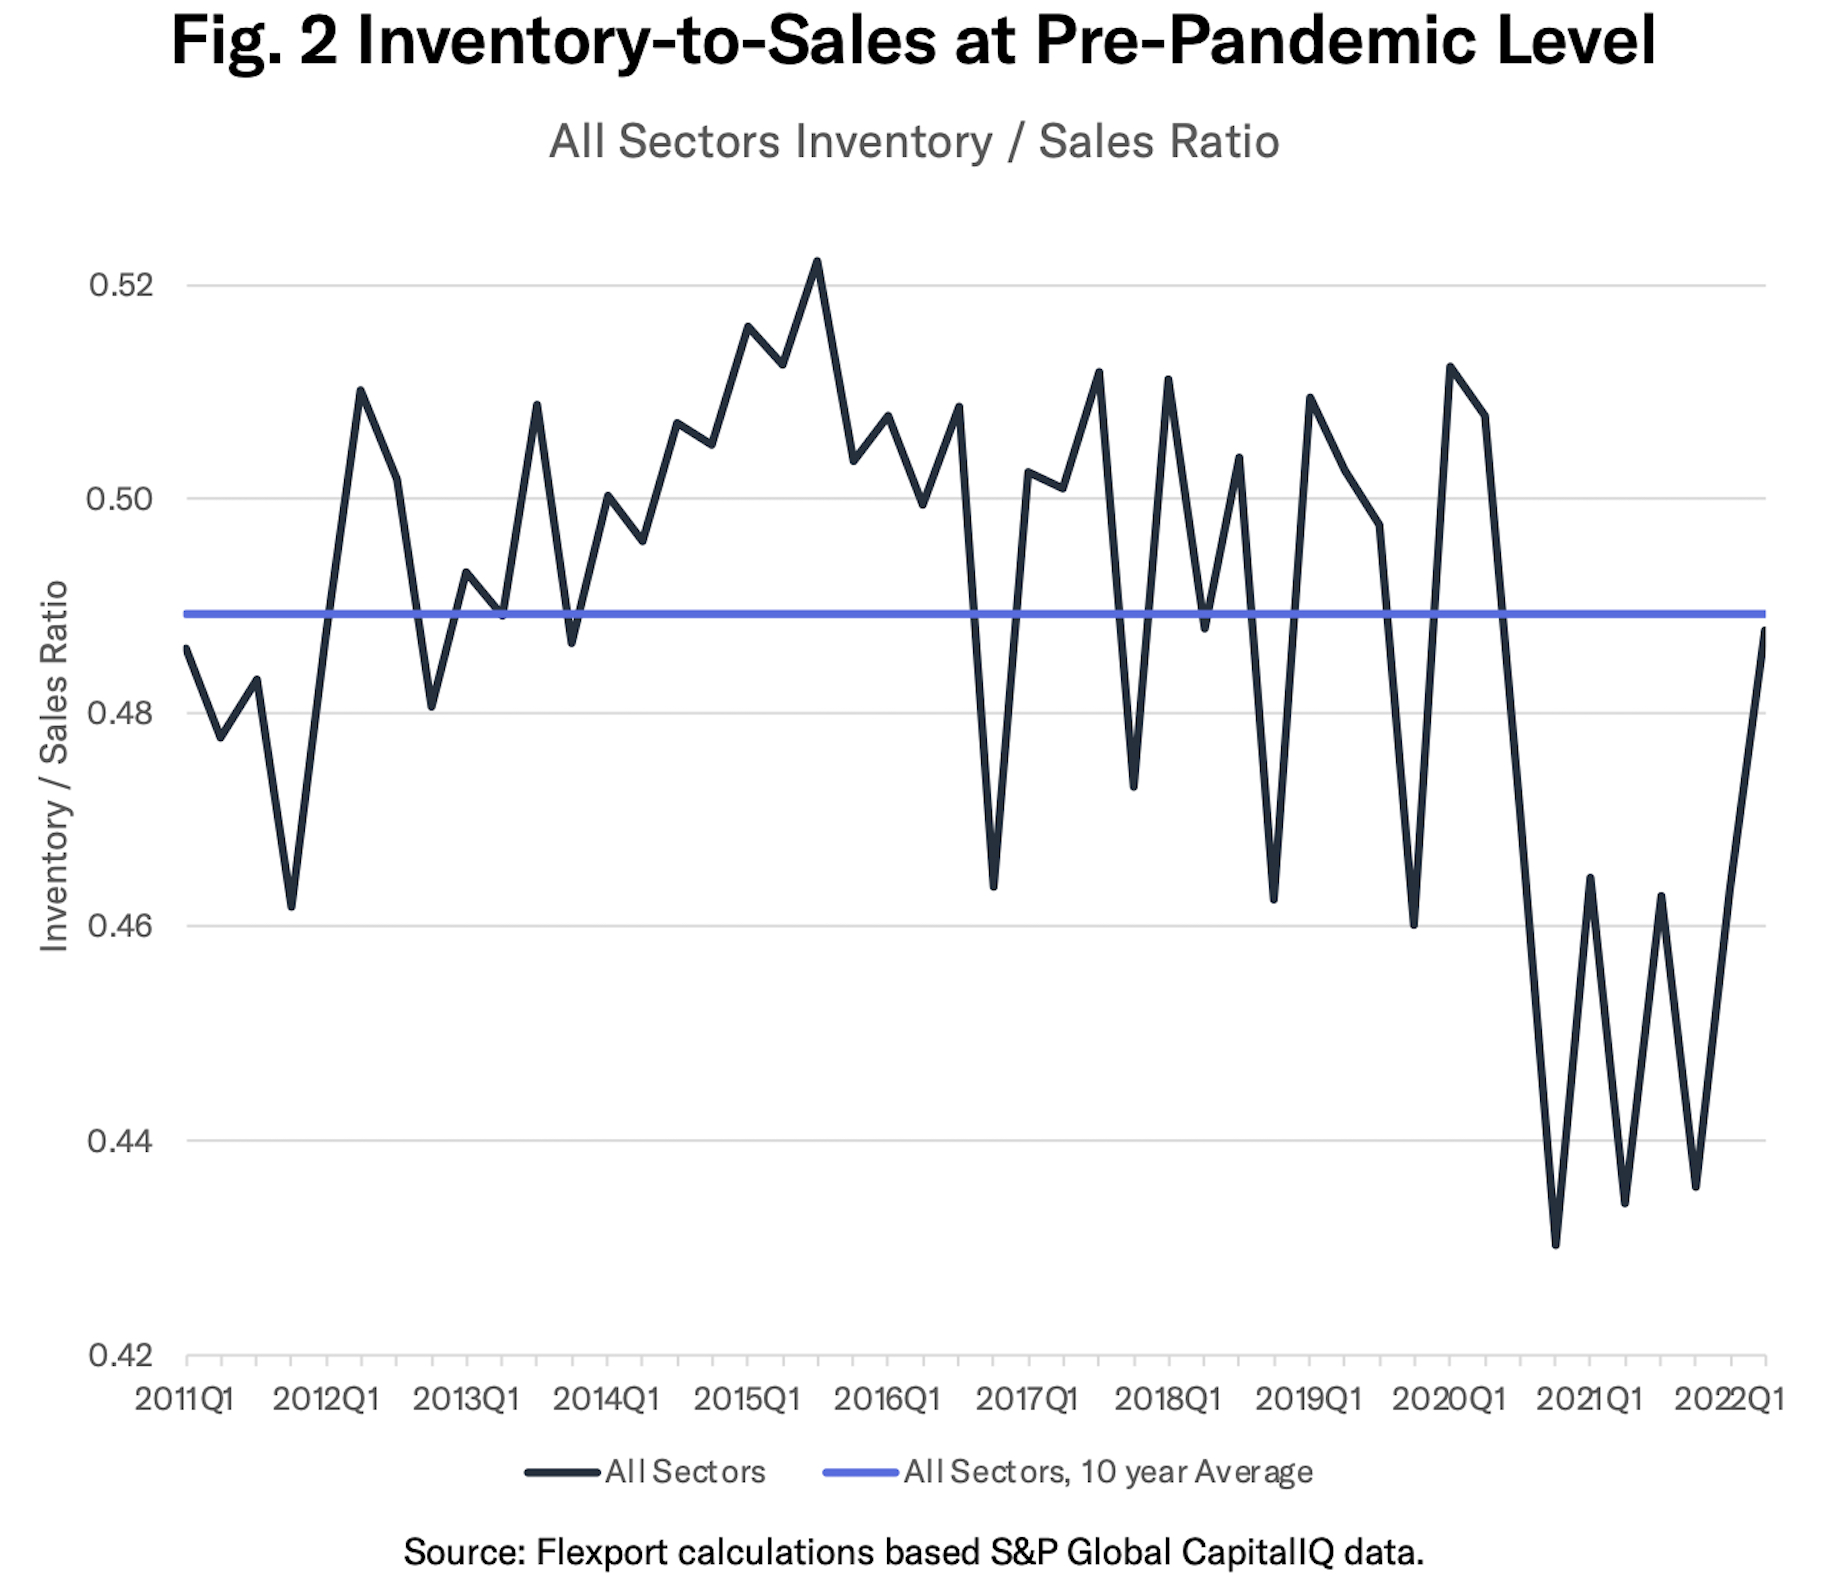
That led the inventory/sales ratio—a guide to the long-term adequacy, or otherwise, of inventories—to jump to 0.49x in Q2’22 from 0.46x in Q1. That’s the highest since Q2’20, as shown by the indigo line in Figure 2, when sales were distorted by the pandemic lockdowns. It’s also close to the 0.50x average for Q2 in the 2011 to 2019 period.
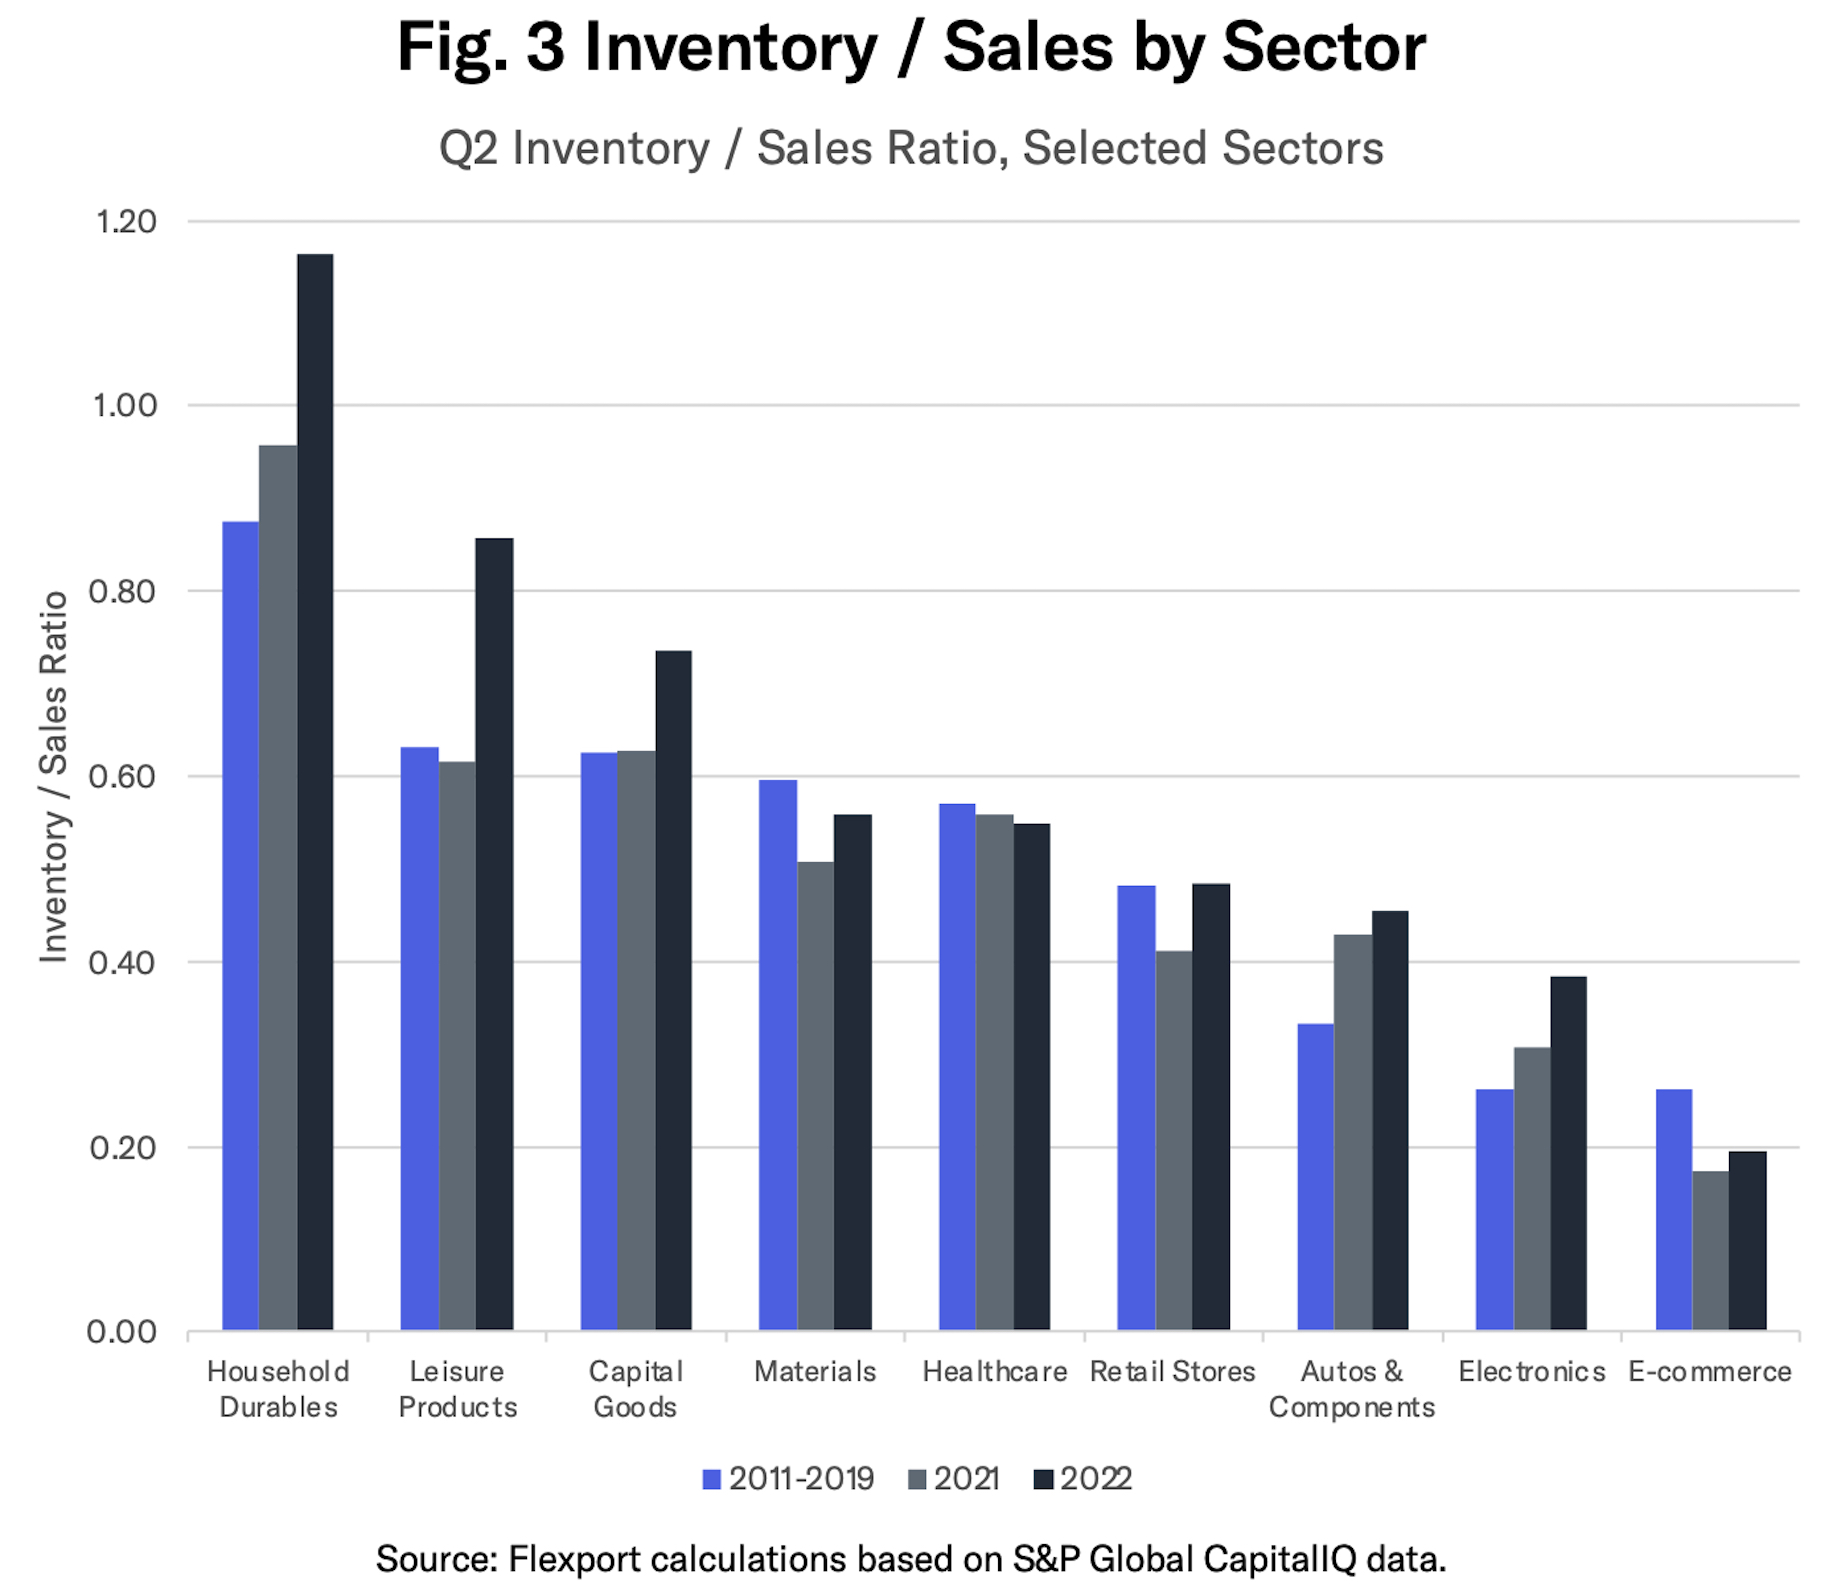
Healthcare was the only one of the nine manufactured-goods centric sectors tracked in the analysis to see its inventory-to-sales ratio drop in Q2’22 (black bar in Figure 3) versus Q2’21 (gray bar). That was likely due to reduced need for COVID-19 related PPE and similar supplies. Note that data for Q2’20 is excluded due to widespread store closures linked to the pandemic in April and May 2020.
Five of the nine sectors are also at ratios above the 2011 to 2019 average level (indigo bar in Figure 3). That could be interpreted as showing inventories are over-built versus historic levels, though there are many corporate motivations for doing so, which are flagged below and will be discussed in more detail in future research.
The widest proportional gap is in electronics, where the ratio of 0.38x Q2’22 ratio compares to the Q2’11 to Q2’19 average of 0.26x. The gap for household durables, leisure products and autos is equivalent to a decline in inventories of around 25%.
Notably, the in-store (as distinct to e-commerce) retail industry has seen its inventory-to-sales ratio jump to 0.48x in Q2’22 versus 0.41x in Q1’22, though that only returns it to levels seen in 2011-2019. Among the retailers, there is a significant disparity between textiles and apparel (0.82x in Q2’22 versus the long-term average 0.67x) and food/staples (0.32x versus 0.35x).
Transatlantic Divide - Macro Data Shows EU Ratio Rising
Macroeconomic data provides lower latency and higher frequency assessments than corporate data, albeit at a less granular level. Data for the U.S. show that the overall inventory-to-sales ratio for retailers, excluding autos, held steady at 1.16x in July 2022. That was the same level as in June and May. That may indicate inventory management is under control.
Inventories in the autos sector are increasing, with a rise to 1.46x in July compared to 1.34x in Q2’22. That’s still well below the 2.26x average from 2016 - 2019, indicating an ongoing hangover from pandemic-era electronic component shortages.
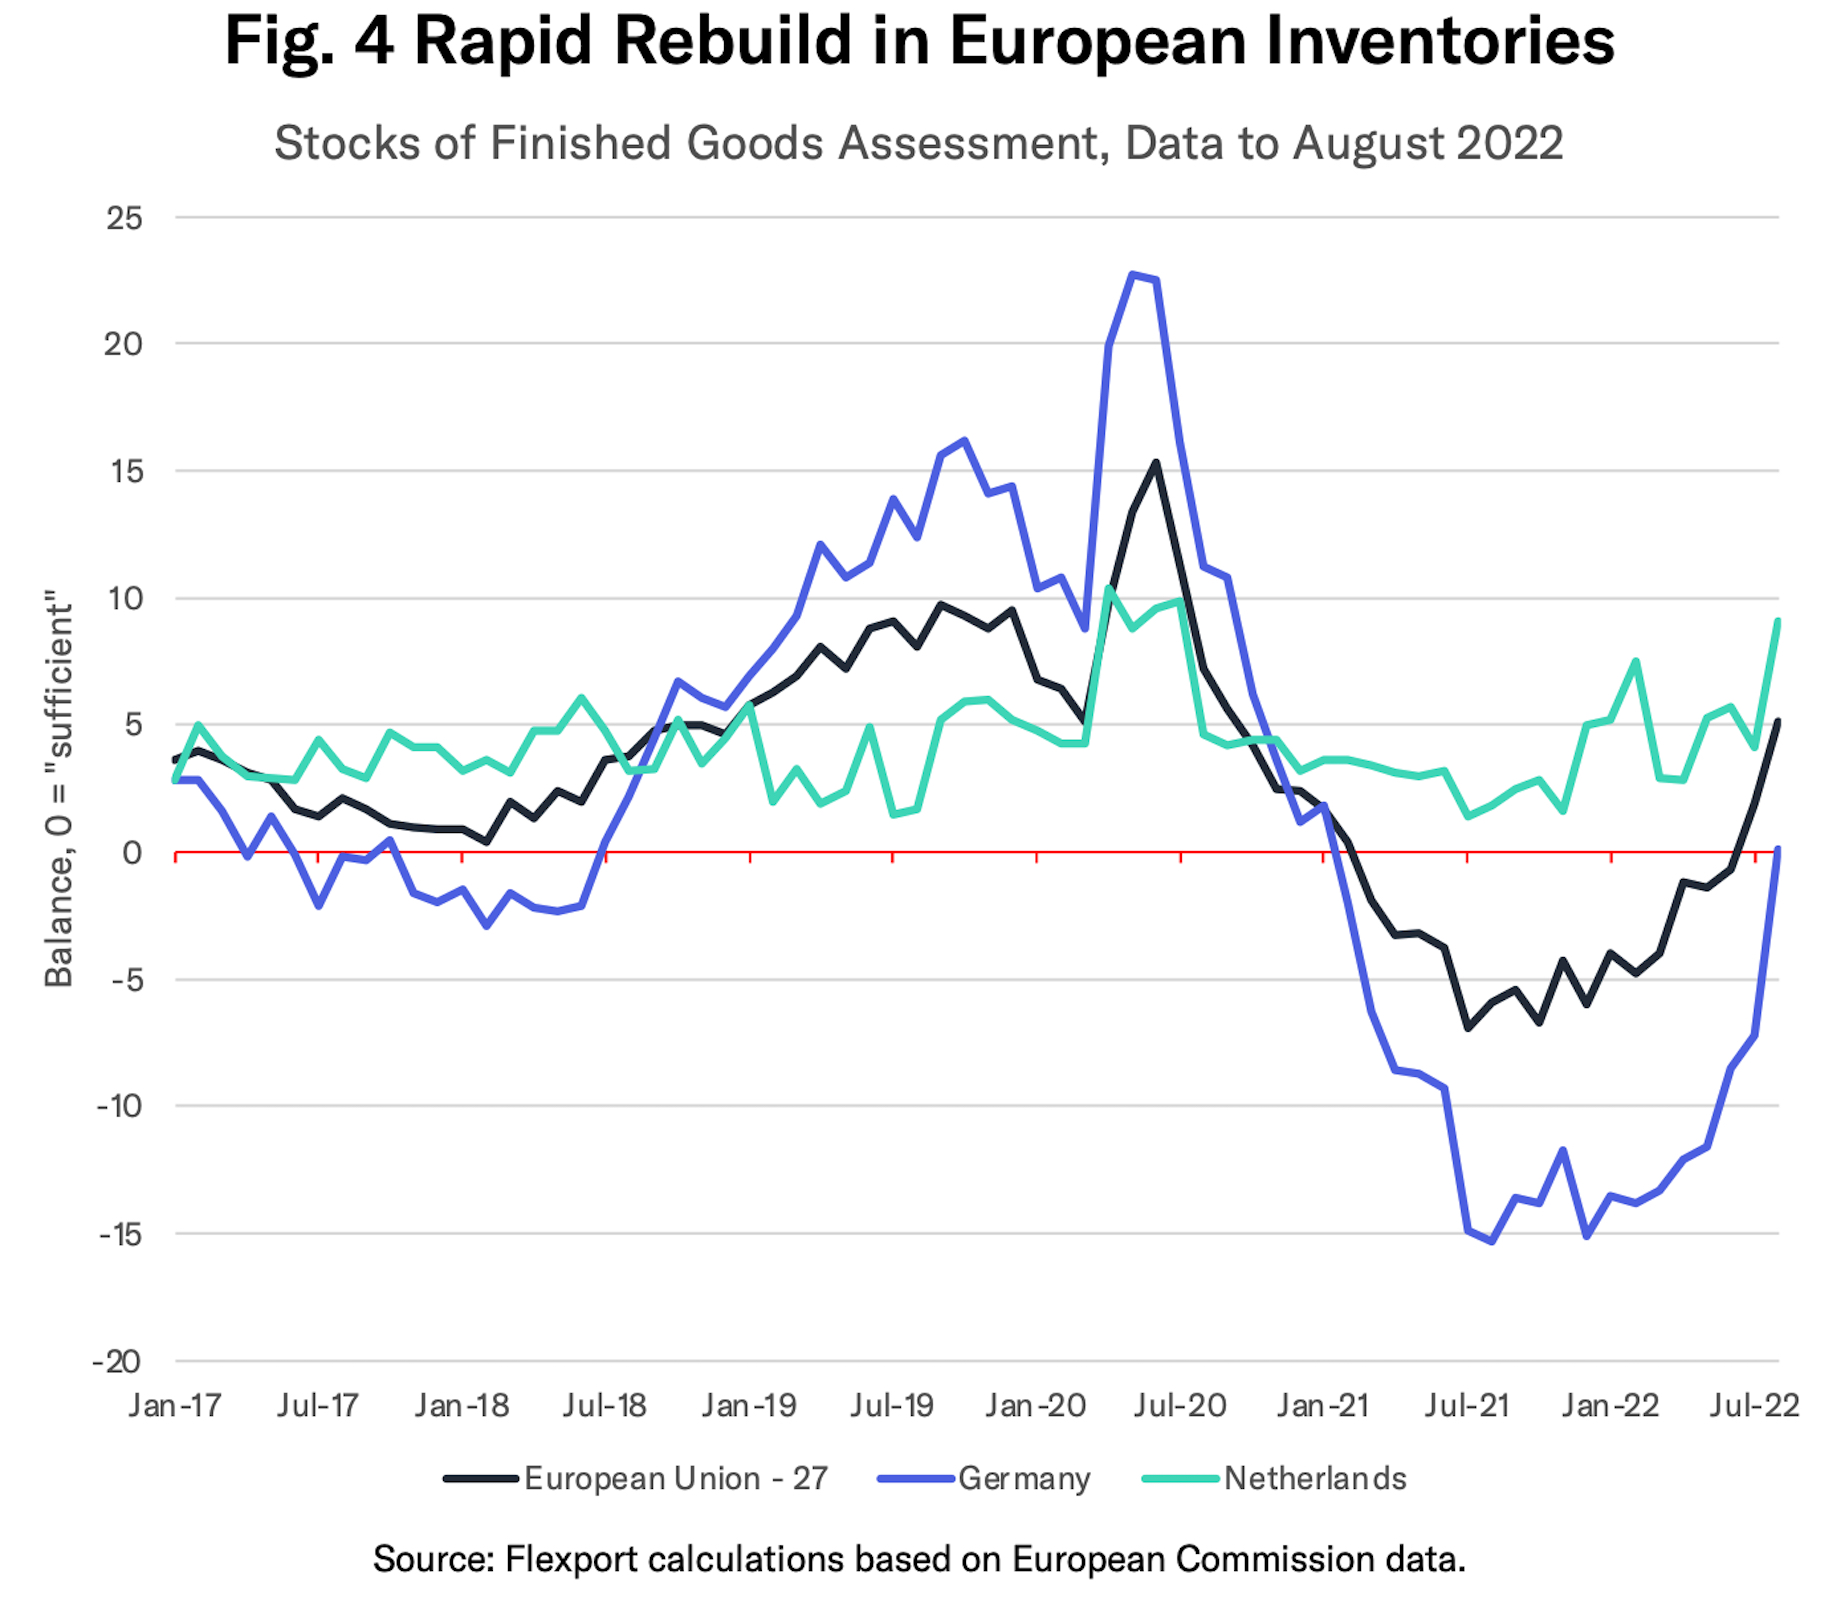
The situation in the EU is somewhat different. The European Commission’s monthly survey of inventory conditions (shown in Figure 4 where a reading of zero indicates “adequate” inventories), shows a continued build up of inventories. As of August 2022, inventory conditions across the EU (black line in Figure 4) reached their highest since September 2020.
Inventories in capital-goods heavy Germany (indigo line) moved to above-adequate levels for the first time since January 2021 in August. Inventories in the consumer-goods oriented Netherlands (green line) are at their highest since July 2020.
Buy Early, Sell Cheap - Corporate Inventory Strategies
Coming back to corporate data, management teams have become increasingly preoccupied with inventory levels over the past 12 months. Flexport’s analysis of CB Insights data shows that 33% of earnings conference calls held in the July 1 to August 31 period mentioned inventories.
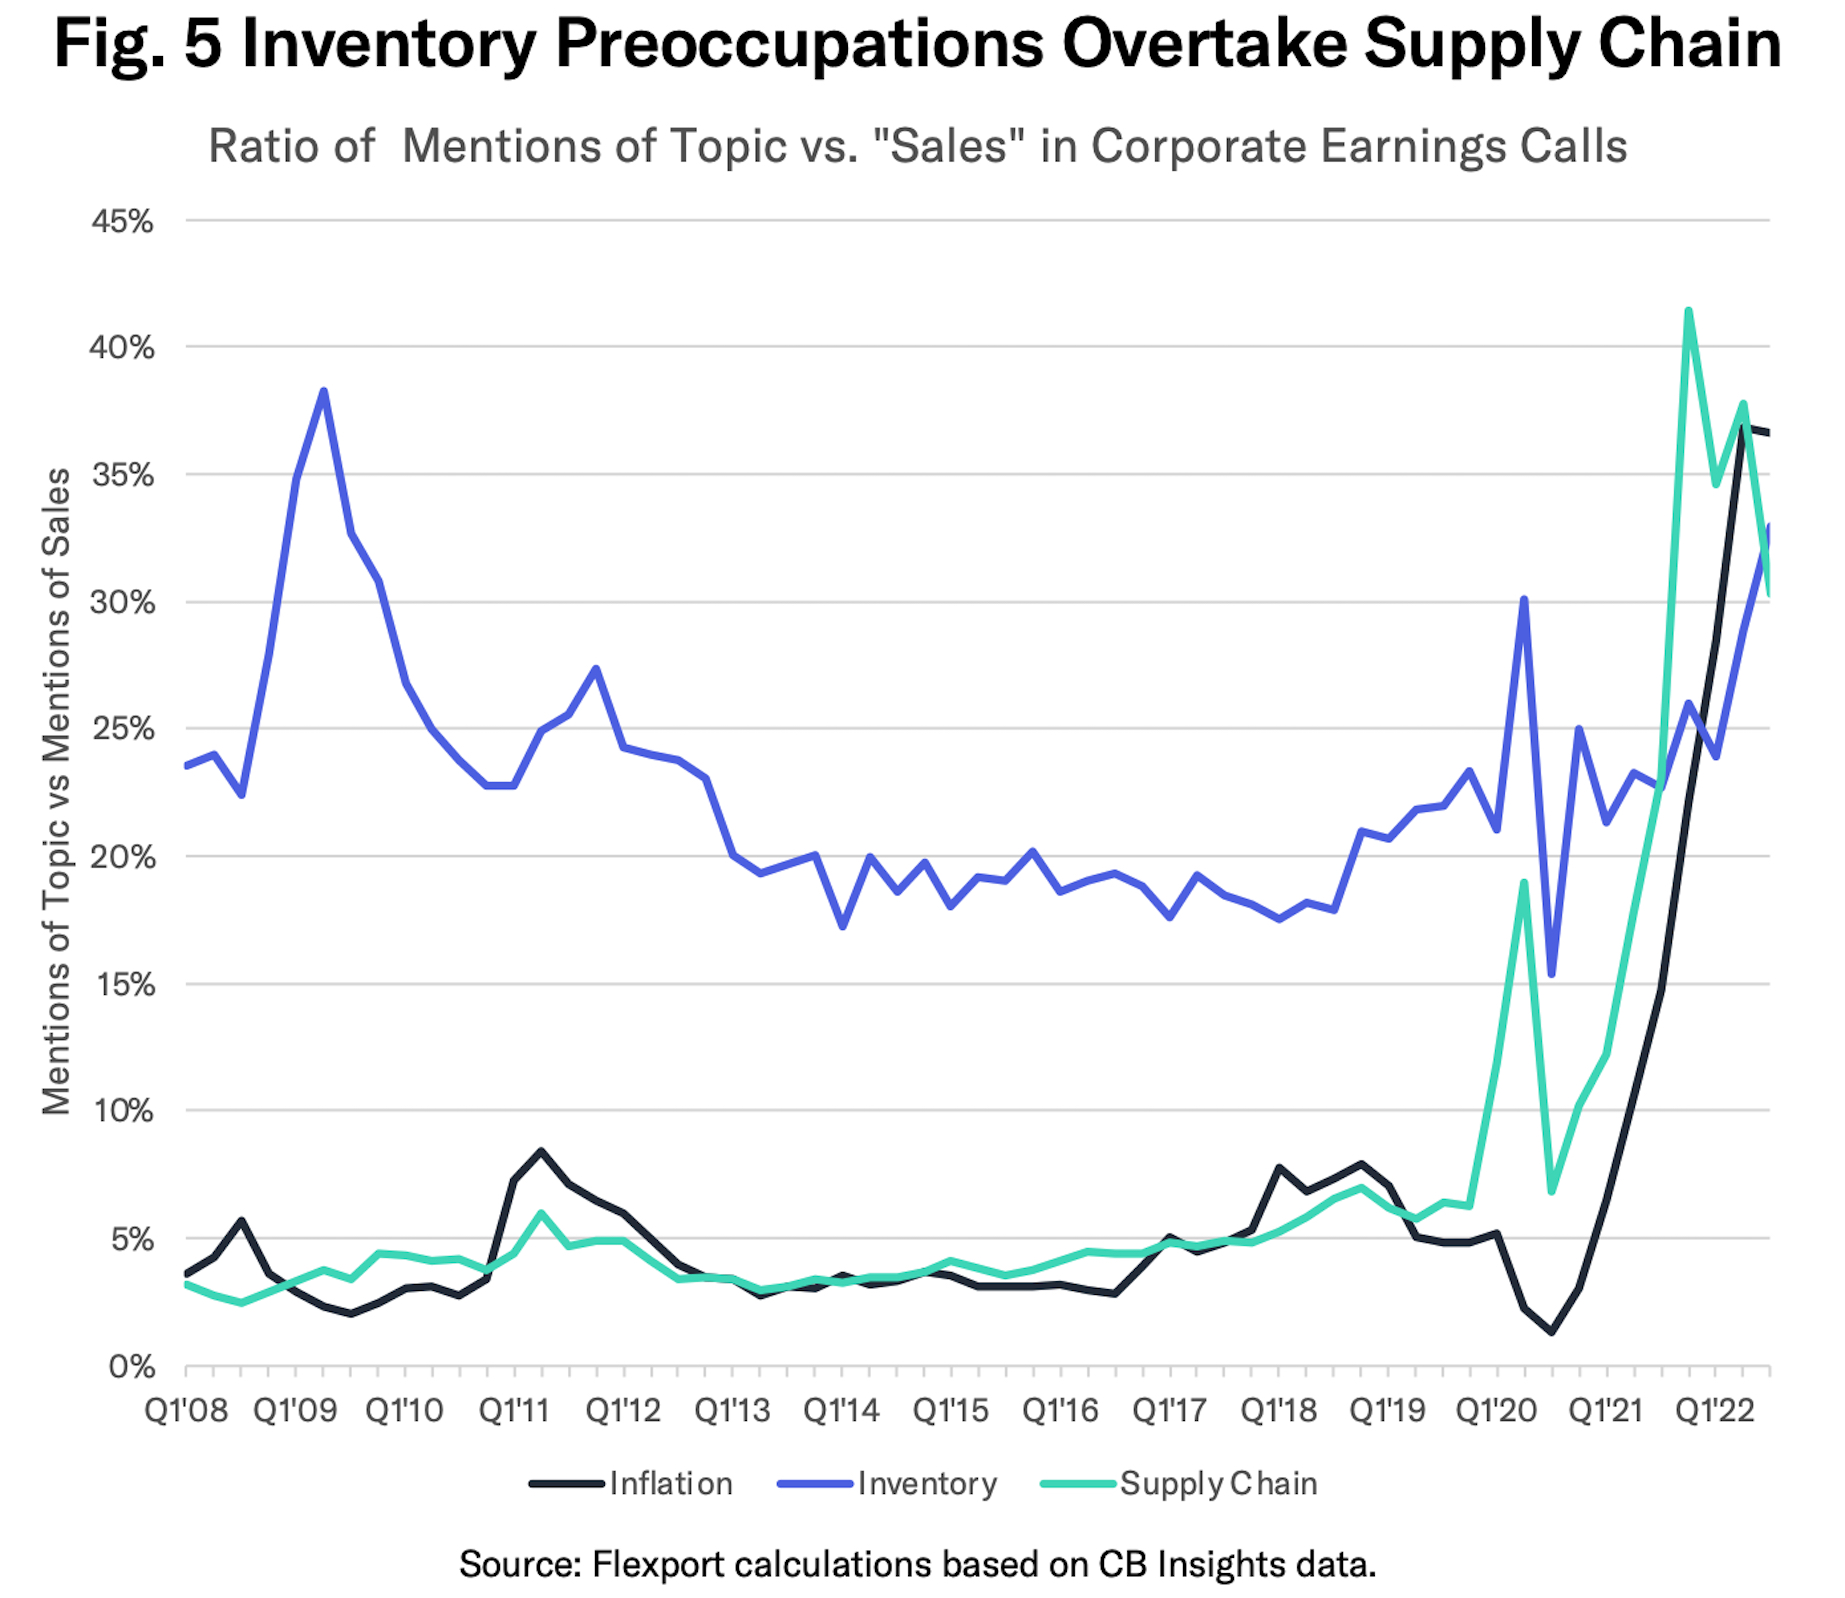
As shown in the blue line in Figure 5, that was the highest since Q2 2009. It also overtook mentions of “supply chains” more broadly (green line) which fell to 30% from a peak of 41% in Q4’21. Inflation remains a widely discussed topic, featuring in 37% of calls (black line).
Flexport’s detailed review of management commentary from over 130 firms in July and August 2022 yields a wide-range of reasons why inventory balances have increased.
- Sales that have fallen below original demand projections.
- The arrival of products that had been delayed in the shipping process.
- A desire to avoid repeats of earlier stock-outs during the seasonal shopping period.
- Pre-empting further cost inflation by front-loading purchases of materials and finished products.
- Expectations that consumers’ will try to beat further price inflation by carrying out seasonal shopping earlier.
The review also yields a wide-range of inventory-management strategies, including:
- Canceling orders or delaying non-seasonal deliveries into latter time periods.
- Pausing production and retaining materials or components for later use, rather than sitting on finished goods. This is often combined with furloughing staff.
- Deferring new product launches to avoid cannibalizing sales of existing product lines.
- Discounting, or reducing prices at the retail end of the supply chain to sell unsold inventories. In a more extreme version firms have used specialist stock liquidators.
- Pack-and-hold strategies, which involve removing non-seasonal products from shelves for sale later in the year or in 2023.
The motivations and solutions across different sectors will be the topic of forthcoming research.
In conclusion: Corporate financial data shows that inventory-to-sales balances among North American firms have rapidly rebounded to pre-pandemic levels. Macroeconomic data shows European firms have been slower to catch up. A review of company earnings transcripts show an increased focus on inventories, with a wide range of reasons for the ramp-up and a lengthy list of strategies for managing them.
Disclaimer: The contents of this report are made available for informational purposes only and should not be relied upon for any legal, business, or financial decisions. Flexport does not guarantee, represent, or warrant any of the contents of this report because they are based on our current beliefs, expectations, and assumptions, about which there can be no assurance due to various anticipated and unanticipated events that may occur. This report has been prepared to the best of our knowledge and research; however, the information presented herein may not reflect the most current regulatory or industry developments. Neither Flexport nor its advisors or affiliates shall be liable for any losses that arise in any way due to the reliance on the contents contained in this report.
About the Author


