

September 6, 2022
South Korea's Canary Sings - Flexport Weekly Economic Report

South Korea's Canary Sings - Flexport Weekly Economic Report

South Korea is the first country to report August trade data, providing a “canary in the coal mine” for global activity. Total export growth is slowing and its shipments of semiconductors have started to fall. Neither bode well for global trade activity or the economy at large.
In Focus - South Korea’s Export Slowdown
Can we get early warnings about the state of global trade from a single country’s data? The South Korean government published data for trade activity in August on September 1st, making it the first economy to do so. It may therefore provide a potential “canary in the coal mine” for changes in trade activity. The latest data does not bode well.
The data for August shows South Korean exports increased by 6.6% year over year, down from a 9.2% increase in July and double-digit growth rates earlier in the year. At the geographic level, trade was dragged down by a 5.4% drop in shipments to China, which may be indicative of weaker manufacturing activity in the world’s factory.
The product-level data also provide considerable causes for concern.
First, the figures are flattered by the elevated rate of inflation in commodity prices. Exports of oil products rose by 36.2% in dollar terms, but export prices for extracted products rose by 60.3% according to the latest data, suggesting a drop in real (i.e. inflation adjusted) terms. Similarly, exports of steel rose by just 2.8% in nominal terms – their slowest rate since December 2020 – while basic metals prices climbed by 17.2%. Total export prices increased by 16.3%, suggesting South Korea’s real exports have fallen in August.
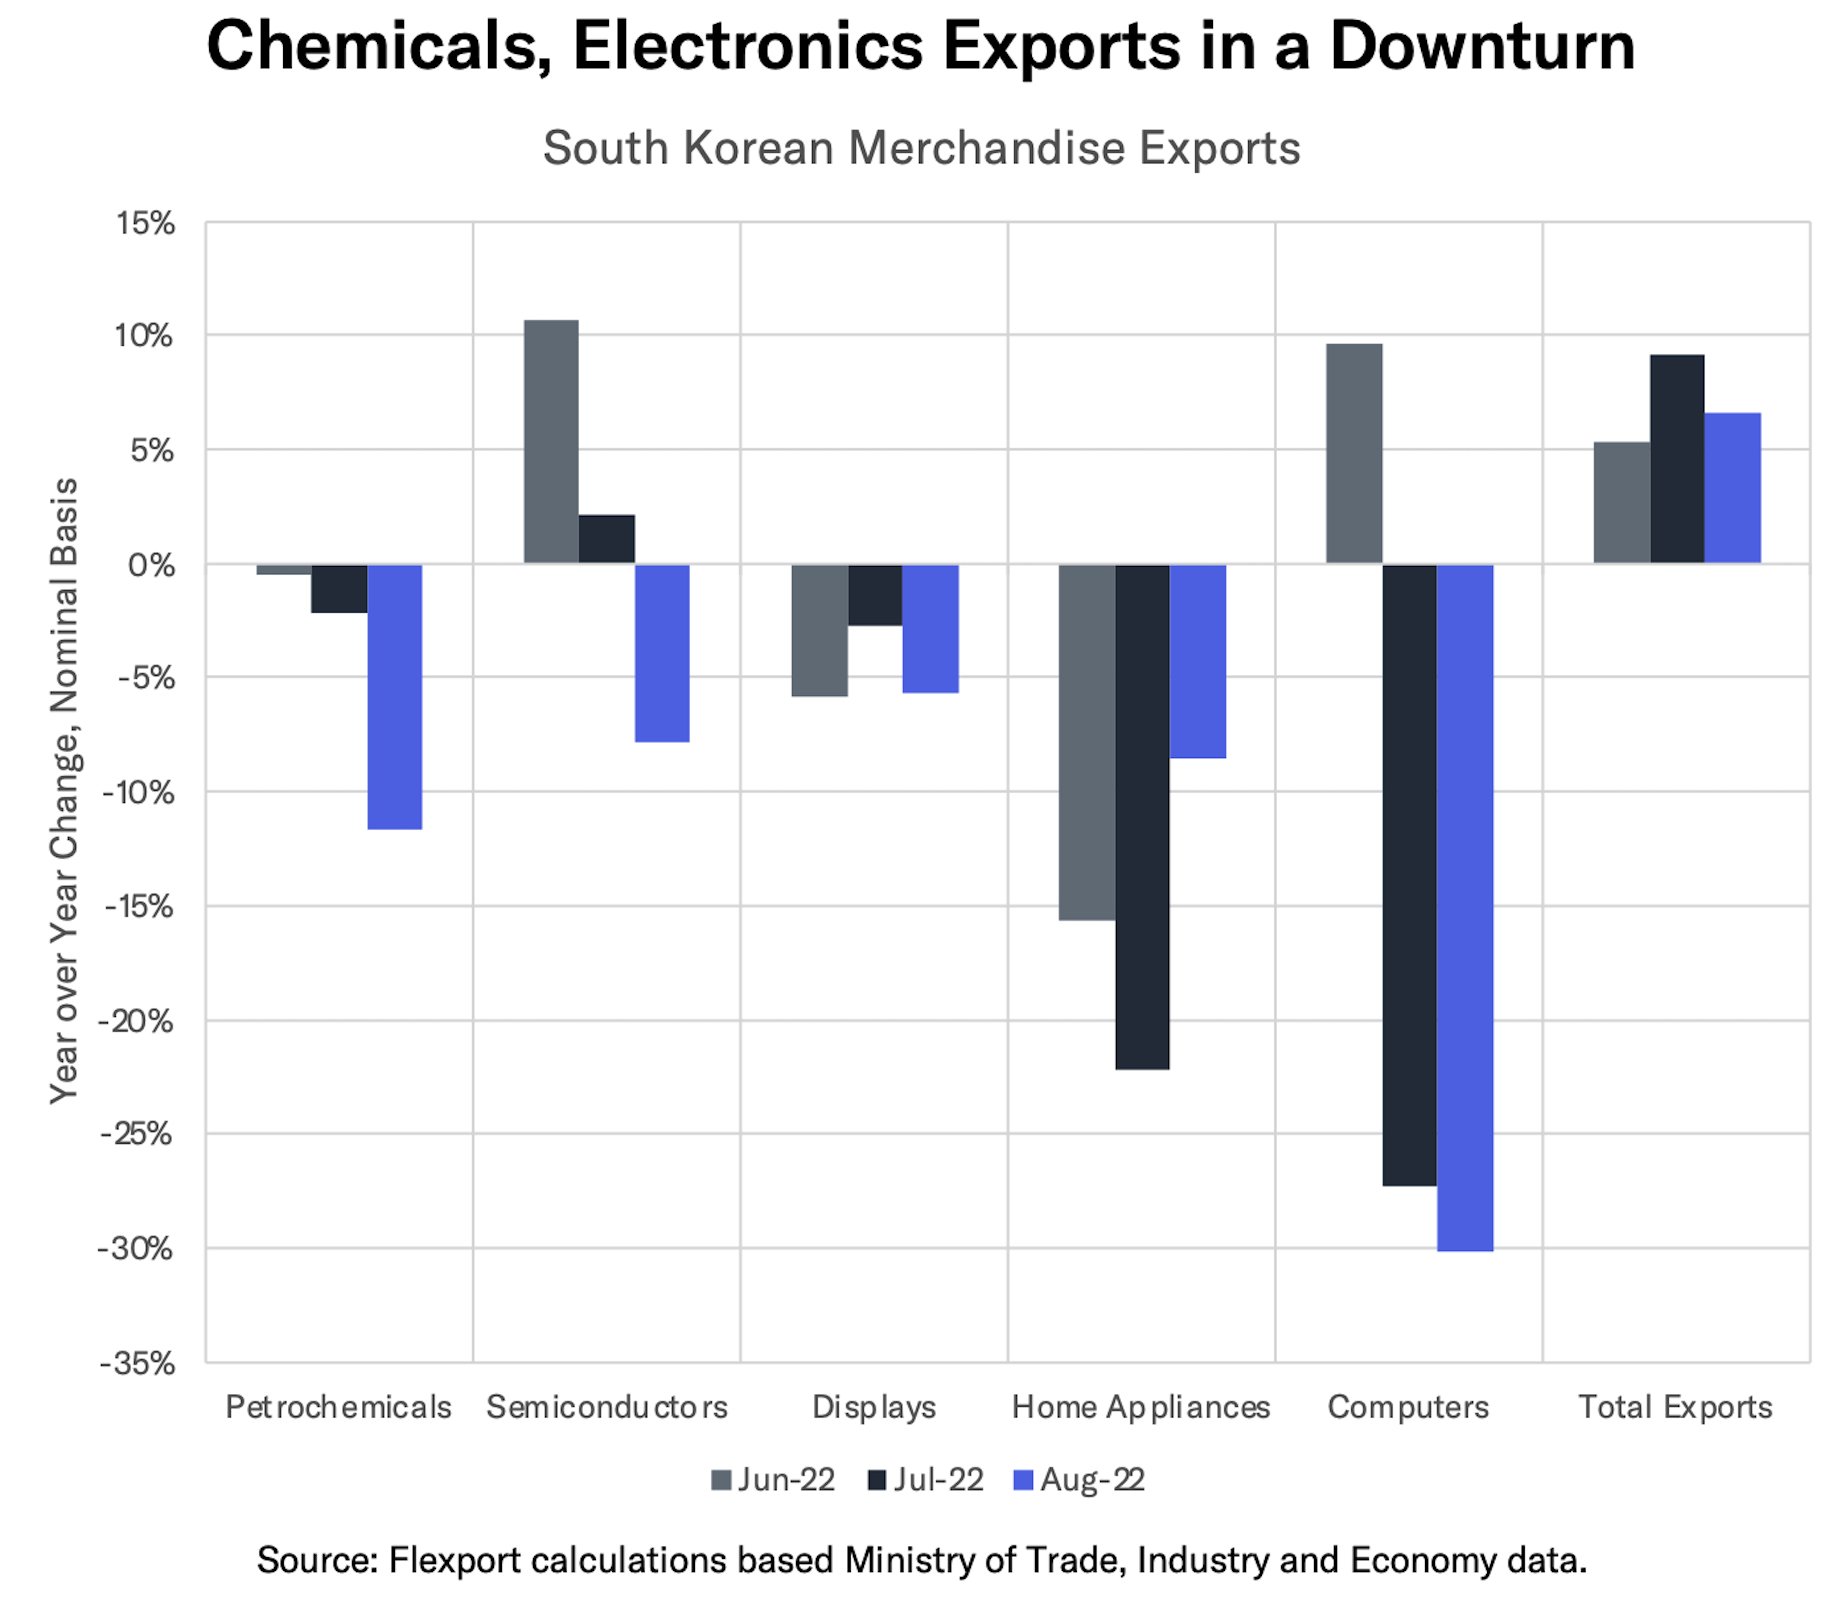
Second, products at the heart of several major, global supply chains have started to fall in nominal terms. Exports of petrochemicals dropped by 11.7%, the third straight decline as shown in the chart above, suggesting weakness in the broader plastics and packaging sectors.
Shipments of critical electronics components are also in decline. Exports of semiconductors dropped by 7.8%, marking the first year-over-year decline since April 2020. South Korea is the third largest producer of semiconductors in the world (after China and Taiwan) and the largest maker of memory chips.
Third, exports of certain consumer durable products are now in reverse. Shipments of telecoms equipment, computers and displays (including TVs) all fell for a second month. Exports of home appliances dropped for a third straight month. While exports of cars and car parts improved, the industry is still digging out from an extended period of supply chain shortages.
There are, of course, caveats to the analysis. For example, South Korea is the world’s fifth largest exporting economy but represents only 3.1% of global exports. It’s also largely absent in several large consumer sectors including apparel and furniture. Both limit the data’s utility in precisely forecasting the global economy.
Nonetheless, with a slowdown in exports overall and marked downturns in key supply-chain and consumer sectors, this data does not bode well for the state of global trade.
You can now receive the Weekly Economic Report straight to your inbox every Monday by signing up here.
Latest Flexport Metrics & Research
The Flexport Ocean Timeliness Indicator for Transpacific Eastbound (TPEB) routes dipped to 86 days, the lowest since July 2021. That marked the first increase after 12 weeks of improving timeliness. Flexport’s Air Timeliness Indicator meanwhile declined to 10.6 days, the fastest since June 2021.
Recent Flexport research reports include a review of our recent State of Trade webinar on supply chain visibility. We show that increasing supply chain complexity, government regulatory demands, and exogenous shocks like the pandemic have made visibility more important than ever.
Economics Data
The U.S. labor market remained moderately strong in August, with plenty of mixed signals to keep it interesting. Payroll employment was up by 315K in the month, though June and July jobs were revised down a combined 107K from previous reports. The unemployment rate rose to 3.7% – still a historically low number – and that came with an increase of 0.3% in the labor force participation rate.
- The Job Openings and Labor Turnover release for July showed the number of job openings per unemployed person remained at an all-time high of 2.0. There is some evidence this is a more reliable measure of labor market tightness than the unemployment rate.
- Euro Area unemployment fell to an all-time low of 6.6% in July.
U.S. retail inventories, excluding autos, increased by 0.4% sequentially in July, matching an earlier-reported 0.5% rise in sales. As a result the inventory / sales ratio for retail, ex-autos, held at 1.16x for a third straight month, the highest level since May 2020. Inventory / sales for autos improved to 1.46x from 1.39x in June, marking the highest since February 2021.
- EU business inventories increased in August according to a survey conducted by the European Commission. A reading of +5.1% (where 0% indicates balance and a positive number shows excessive inventories) was up from 1.9% a month earlier. It continues a steady increase since a trough of -6.9% in July 2021.
German exports fell by 2.1% sequentially in July. Shipments to the U.S. dropped by 13.7% while exports to China dipped by 0.3% and those to the EU rose by 1.0%. The reduced exports to the U.S. suggests that the ongoing weakness in the euro versus the dollar has done little to improve Germany’s export fortunes, as discussed in recent Flexport research.
- At the product level, the leading contributor to the decline in euro-terms were exports of autos and parts, which dropped by 7.4% sequentially. Steel and copper exports fell by 13.9% and 19.5% respectively, partly reflecting a recent downturn in commodity prices.
German businesses have cut manufacturing by 21% in July versus a year earlier, in part as a response to elevated energy costs according to the BDI industry association. The glass industry has proven particularly susceptible.
Consumer confidence in the EU improved modestly, with a diffusion index of -26% in August (versus a 10-year average of -11%) compared to -27% in July. That was, nonetheless, the second worst reading, after July’s, since the survey began in 1985.
- The Euro Area Harmonized Index of Consumer Prices (HICP) increased by 9.1% year over year in August. That was the fastest increase in the series since it began in 1997. The main driver remains energy prices, which rose by 38.3% year over year due to shortages which can be linked to the conflict in Ukraine.
U.S. manufacturing activity held constant at its 26-month low in August, according to the latest ISM survey, with a reading of 52.8% (over 50% indicates expansion). Export order activity increased while the import order reading dipped - both continued to indicate growth. Inventory balances are continuing to grow, though at a slower rate than a month earlier.
- A similar survey of manufacturing activity in China, run by the government, remained in contractionary territory for a second month at 49.4% in August (again, 50% indicates expansion). That was up slightly from 49.0% a month earlier. An improvement in import and export activity measures was offset by worse supplier timeliness.
Policies & Regulations
The U.S. government will continue its Section 301 duties on imports from China. That’s the result of a technical requirement, following a continuation request from U.S. firms. A review will continue, while the Biden administration’s long-term policy remains unresolved.
The U.S. has rejected a request to investigate labor standards at a factory owned by autoparts maker BBB Industries in Mexico. The request, made under USMCA regulations, was rejected on technical grounds. Thus far, there have been five such complaints in the autos industry which have been investigated, of which four have been resolved.
- Canada has launched a complaint regarding U.S. lumber import restrictions under USMCA rules. The trade in softwood lumber represents one of the longest-running disputes between the two countries, though Canada still represented 79% of U.S. imports of softwood lumber in the 12 months to June 30.
The EU is close to providing new plans to manage elevated energy costs via market intervention. That could involve moving to average rather than marginal cost pricing. Any measures will need member states’ support. The Czech Republic and Belgium have already expressed support.
- Supplies of natural gas to France by Gazprom have been cut, at the same time that Gazprom has extended an outage of the Nordstream 1 gas pipeline indefinitely. The IEA has noted that even with gas storage in the EU at 90% – versus 80.3% as of August 30th – there is still an elevated risk of supply disruptions from February onwards.
- Challenges in Europe are having a global knock-on effect. China has released imported volumes to the market, partly reflecting reduced demand there. The Japanese government also plans to buy on behalf of its utilities if prices get too high or their funding too low.
- The G7 has made progress in its previously announced plans to apply price caps to Russian oil exports to their countries. The intent to apply a cap was announced in July as part of wider sanctions against Russian oil exports. Russia has already stated it will not sell oil to countries that apply a cap.
Supply Chain Update
Auto manufacturing by the big seven Japanese producers continued to struggle in July, with global output down by 4% sequentially to 1.90 million units. While better than the 1.68 million average in Q2’22, that was still 13% below July 2019. Most of the automakers are citing semiconductor shortages and COVID-19 related closures as a driver of the slow recovery.
Two major U.S.-based semiconductor producers have been informed of extended export restrictions, covering their latest high-end, artificial intelligence focused products. The stricter stance from the U.S. government is inline with prior policy and could be extended to other chipmakers’ AI-focused products.
- The world’s largest chip maker has flagged that the current shortage of semiconductors is focused principally on low-end semiconductors such as radio communications and power controllers. The automotive sector is flagged as facing such problems. The firm has warned that “the age of an efficient, globalized supply system has passed.”
Chart of the Week - Fully Masked
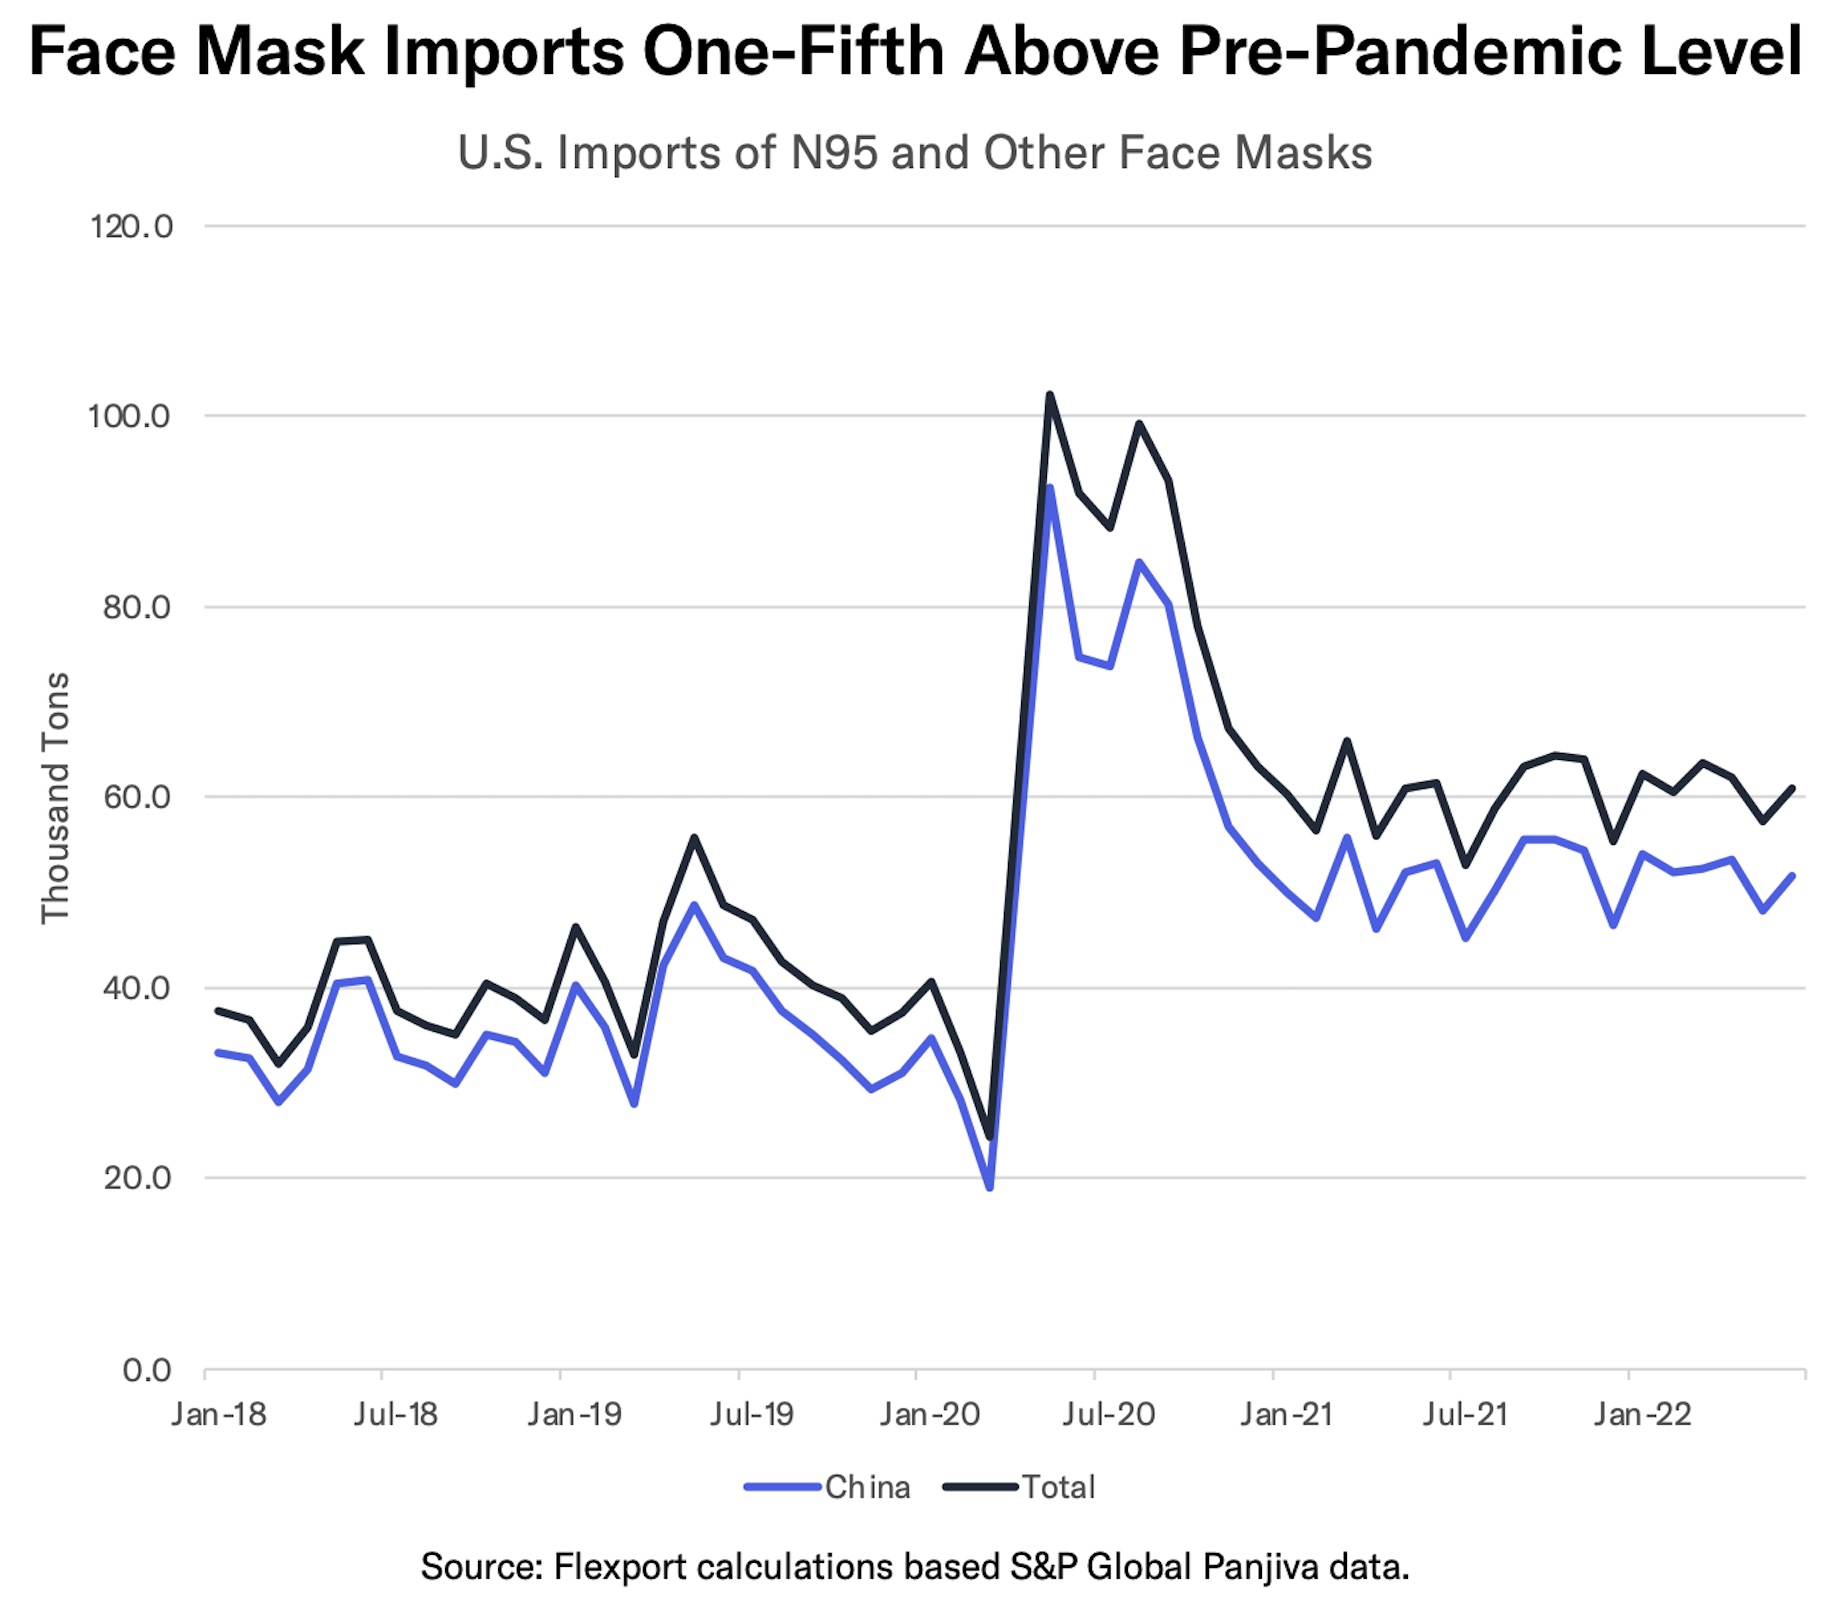
The U.S. FDA has removed N95 face masks from its “medical device shortage list”, citing “increased domestic manufacturing of N95 respirators” which means that “demand … no longer exceeds the supply.” That also comes as the government plans to reduce its purchases of treatments for COVID-19 including test kits and vaccines.
There have been signs of a marked decline in U.S. imports of face masks since early 2021, as shown in the chart above. Imports in Q2’22 were 36% below their Q3’20 peak, though they were still 19% above Q2’21. Imports continue to be dominated by China, which accounted for 85% of imports in the past 12 months.
Disclaimer: The contents of this report are made available for informational purposes only and should not be relied upon for any legal, business, or financial decisions. Flexport does not guarantee, represent, or warrant any of the contents of this report because they are based on our current beliefs, expectations, and assumptions, about which there can be no assurance due to various anticipated and unanticipated events that may occur. This report has been prepared to the best of our knowledge and research; however, the information presented herein may not reflect the most current regulatory or industry developments. Neither Flexport nor its advisors or affiliates shall be liable for any losses that arise in any way due to the reliance on the contents contained in this report.
About the Author


