

January 21, 2022
Understanding the Logistics Pressure Matrix

Understanding the Logistics Pressure Matrix

No single measure can capture the full complexity of supply chains. Many of the challenges we're facing in early 2022 are a result of elevated consumer spending matched with the fixed availability of logistics services. This report characterizes eight clusters of data-points and determines whether they are yet pointing to a slowdown in activity and / or improvement in the fluidity of supply chains. We combine these into the Flexport Logistics Pressure Matrix to provide an overview of supply chain activity and complexity.
The global logistics industry enters 2022 with many of the similar challenges it faced in 2021: elevated demand for services linked to robust consumer and industrial spending; little ability to flex supply upwards given long-lived assets; ongoing risks from exogenous shocks; and cascading bottlenecks through logistics networks.
No single measure can hope to capture the complexity of the challenges, but taking a broad sweep of data points can provide a guide to whether stresses are starting to dissipate.
This report considers eight categories of measures with a view to providing a sequential assessment of the demand for logistics services and measures of the use of logistics networks. For each we’ll provide key characteristics of the metrics, reasons for tracking them, their current values and available alternatives.
On the demand side we’ll outline measures that cover aggregate, current household consumption as well as expectations from consumers and manufacturers as to the outlook for future demand. We’ll then look at retail sales and inventories-restocking of the latter is a key determinant of future international trade flows.
The handling of freight—both inland and at the major seaports—can provide a direct sense of whether network usage is rising or declining. Shipping rates provide a market participant’s view of current and future congestion.
Finally, we take an alternative look at Flexport’s measure for ocean shipping times to determine whether there are signs of logistics networks becoming less congested.
While focused on US statistics, similar metrics will be applied for Asia and Europe in future research. Regular updates for all eight measures will be available in the Key Indicators section of flexport.com/research.
Personal Consumption Expenditure
Key Characteristics & Sources
The ratio of US Personal Consumption Expenditures (PCE) spent on goods versus services, is most effectively measured via a seasonally-adjusted annual rate basis from the US Bureau of Economic Analysis.

Reason for Tracking
Flexport Research has previously argued that the current congestion in logistics networks globally has been largely driven by rapidly surging consumer goods demand meeting fixed supply of infrastructure. As a direct, timely measurement of consumers’ spending patterns the data can provide insights into the demand side of the equation.
Latest Value
The ratio of goods spending as a proportion of total spending, shown in Figure 1, dipped to 39.8% in November from 40.1% a month earlier, but remains well above the 35.9% average in 2019. A variation in the order of over one percentage point would be needed to signal a clear relaxation of pressure.
It’s also worth noting that spending on durable and non-durable goods fell by 0.8% sequentially in November. That nonetheless meant spending was 7.9% higher than a year earlier and 16.8% above the same period in 2019. A sustained drop in spending on that basis would count as a sign of reduced pressure on logistics networks.
Also Consider
Personal spending is of course partly a function of personal income. Data from the US Bureau of Economic Analysis for November 2021 shows incomes rose by 7.4% on an SAAR basis compared to a year earlier and by 11.7% versus the same period of 2019. It’s also yet to drop below the March 2020 level, a period representing the COVID-19 related recession which was unusual as incomes didn’t fall.
Flexport’s Post-Covid Indicator provides a short-term forecast for the direction of the mix of consumer spending between goods and services. Our latest forecast, published on January 14, 2022, indicates the preference for goods will likely remain elevated during the first quarter of 2022.
Forward-Looking Confidence Measures
Key Characteristics & Sources
The University of Michigan’s “Surveys of Consumers” measures current consumer sentiment and expectations for future conditions. The Institute for Supply Management’s Manufacturing Purchasing Managers’ Indices (ISM Manufacturing PMI) is used to assess industrial sentiment.

Reason for Tracking
Consumer sentiment can drive future spending and orders. In some ways it is a precursor to the spending measures discussed above and the retail sales statistics that follow. Consumer expectations of future conditions arguably indicate best what might happen next.
Manufacturers’ expectations for import orders are a direct driver of future shipping activity. While orders may not directly track prior months’ expectations they can provide a guide to direction. Related predictive metrics for export orders, supplier delivery times and manufacturing inventories also provide useful insights into future trade activity.
Latest Value
Consumer expectations ticked lower in January, as shown in Figure 2 above, and remain well below levels seen earlier in 2021 and before the pandemic. That may reflect concerns about the resurgence of COVID-19 as well as accelerating consumer price inflation.
Industrial import expectations became more positive in December after being negative in October (the first negative reading in 16 months). A sustained decline below 50 (the level indicating a neutral outlook) would be needed to assume reduced pressure on logistics networks.
Also Consider
There are other suppliers of industrial and consumer confidence measures including IHS Markit and the Conference Board. These provide a wider range of measures but come with premium pricing typically aimed at the fund management and investment banking community.
International measures are available with data for China available from the China Federation of Logistics Professionals and for Europe from Eurostat. We’ll be expanding the Flexport Logistics Pressure Matrix for international measures in future releases.
Retail Sales and Inventories
Key Characteristics & Sources
US Advance Retail Sales figures and Advance Retail and Wholesale Inventories, published by the US government, are available on a monthly basis. Sales are published around two weeks after the close of each month with inventories arriving two weeks after that.

Reason for Tracking
Retail sales figures provide a guide as to whether consumer spending plans are actually being put into effect. Data on sales store-type can also provide an indication of which products are in demand, though this can be clouded by the mix between store and non-store (e.g., e-commerce) sales. Inventory-to-sales ratios provide a guide to availability as well as the potential need for restocking.
Latest Value
Retail sales, excluding autos and parts, dipped by 2.5% sequentially in December 2021 but remained 15.7% higher than a year earlier having reached a record high in November. A sustained downturn in sales would be needed to indicate a relief of pressure on logistics networks.
The balance of inventory to sales has been little changed at 1.06x in the past four months to November 30 but is well below the 1.21x average of 2018 to 2019. That may indicate a need for restocking in the post-pandemic period. Retailers may decide, however, that lower inventories and tied-up cash-flows may be a better financial model for the future. A sustained move of more than the 0.01x per month seen recently is needed to reflect a marked shift in behaviors.
Also Consider
The retail sales and inventory dataset is a rich one, with additional insights available from looking at absolute levels of inventories and percentage changes in the same. There are also store-type specific figures that are more important for logistics, for example low value-per-volume segments such as furniture.
Corporate results commentary as well as bespoke analyses for e-commerce such as that from Mastercard among others can provide lower latency at the cost of covering a smaller proportion of total consumer spending.
Inland Freight Handling
Key Characteristics & Sources
Rail operations can be tracked using Surface Transportation Board data for Class 1 railroad operators. That includes the volume of intermodal freight cars handled on the network as well as terminal dwell times for all railcar types. Data is published weekly on the Thursday following the end of each week. For our purposes the data is shown on a four-week trailing average basis due to the volatility of the weekly data series.

Reason for Tracking
Railroads handle inbound container traffic from key seaports and so provide both: (a) data for the volume of activity on a higher-frequency basis than the ports which report monthly (see below), and (b) an indication of network congestion by tracking terminals inland from key seaports.
Latest Value
Total handling of containers by the eight Class 1 Railroads fell by 11.7% in the four weeks to January 12 compared to the four weeks to December 15, suggesting a downturn in volumes carried and potentially less pressure on the system. Compared to the same period in 2021, volumes declined by 10.0%. A stabilization at current levels could indicate reduced pressure on the network.
Dwell times at BNSF’s Barstow Terminal and Union Pacific’s West Colton terminal, both close to the ports of Los Angeles and Long Beach, dipped to an average of 29 hours in the past four weeks compared to 30 hours in the prior four weeks. That may indicate reduced congestion and was lower than the 32 hours prevailing a year earlier.
Also Consider
Rail represents a minority of container freight carried in the US and of freight more broadly. Trucking handled over 70% of all US freight in the US in 2019. Paywalled data from the American Trucking Associations provide a monthly update on volumes around three weeks in arrears. The Intermodal Association of North America also provides monthly, premium data covering trucking and rail with a similar latency.
Deflated International Trade Data
Key Characteristics & Sources
US advance merchandise import and export data from the US Census Bureau, published monthly in the last week of the month following is compared to US import and export price indices from the US Bureau of Labor Statistics, published mid-month for the month prior.

Reason for Tracking
Global trade activity in dollar terms is a direct measure of the demand for logistics services across all modes of transport. However, it is distorted by the impact of shifts in commodity, industrial and consumer prices.
The deflated trade measure deducts the percentage change in trade prices for all products from the percentage change in the dollar value of international trade to provide a proxy for volumes traded. A more detailed examination at the product level—trade prices are provided for many products at HS-4 granularity—can differentiate between containerized and bulk commodities.
Latest Values
The dollar value of US merchandise imports increased by 19.1% year over year in November but import prices rose by 11.7% over the same period. That implies the volume of trade increased by a more modest, but still significant, 7.4% rate.
The sequential change in the “deflated” trade measure for imports was a 4.0% rise in November versus October. That was the fastest rate of change since March 2021 and partly reflects the seasonality in goods shipments ahead of the holiday season.
In aggregate in November 2021 versus January 2019 the dollar value of US imports rose by 20.5% while the deflated value rose by 9.6%. A meaningful, ongoing downturn in the deflated value of imports may be suggestive of reduced pressure on the logistics networks.
Also Consider
Flexport’s Trade Activity Forecast provides a detailed outlook for US imports by commodity category up to three months ahead. The latest published forecast on January 18 called for a renewed rise in imports in Q1’22.
Most government statistics agencies publish international trade figures in local or dollar currency terms, with many also publishing trade price inflation. Multinational, deflated trade figures from the World Trade Organization and the Netherlands Central Planning Bureau are also available at the cost of considerable latency.
Port Handling Data
Key Characteristics & Sources & Sources
Most of the major port complexes publish statistics for imports and exports handled, split between loaded and empty containers, on a monthly basis. We track aggregate handling data for Los Angeles, Long Beach, Oakland, Seattle / Tacoma, Houston, Savannah, Charleston, Norfolk, Vancouver and Montreal during the first three weeks after the month-end while New York and Prince Rupert only become available later.

Reason for Tracking
Experience in the past two years shows that container yard congestion isn’t just a function of unloading inbound vessels, but also ensuring sufficient room is available by clearing outgoing loaded and empty containers. Individual, detailed port data is vital for identifying specific bottlenecks though an aggregate trend also matters given container-lines’ apparent willingness to shift destinations.
Latest Value
The data is aggregated for the 10 “early” reporting port complexes and converted into a “days adjusted” index where the 2018 average is set as the baseline. Volumes handled in November by North American ports fell by 2.3% compared to October. It’s worth noting the comparison to the deflated trade number which rose, potentially reflecting increased shipments by air and by land (from Mexico and Canada).
The volumes handled in November were 7.8% below the peak of May 2021 and 0.9% lower than a year earlier. Some ports have also added temporary capacity via pop-up yards. While declining activity indicates reduced pressure, it should be noted that handling was still 12.1% above 2018 average levels.
It should be noted that despite talk of supply chain and port shortcomings, capacity within the port system is increasing steadily over time as a result of improved efficiency as well as new facilities coming online. However, a return to historic seasonal patterns would be a first marker of normalization while a decline in activity to levels a few percentage points above 2019 levels should represent reduced pressure.
Also Consider
The analysis can be enhanced with premium shipping data from suppliers such as S&P Global Panjiva, ImportGenius, Descartes Datamyne and IHS Markit Piers, allowing both increased coverage and reduced latency compared to official port data.
Port handling figures are also available from other countries, particularly China and Singapore, though timeliness, coverage and granularity vary significantly.
For other modes of transportation, data from IATA - including capacity as well as volumes carried - as well as from individual airports can provide insights into the state of airfreight.
Global Shipping Rates
Key Characteristics & Sources
The Shanghai Shipping Exchange provides the China Containerized Freight Index of container shipping rates for routes outbound from China, including those to the US West Coast and US East Coast. The measure draws on data from 22 container-lines and represents volume-weighted average prices including freight and surcharges on a spot basis. Data is published weekly on a Friday afternoon Shanghai time.

Reason for Tracking
The SSE CCFI provides an indication of all-in charges for shipping leaving China for specific destinations and so provides a near real-time indicator of market conditions (i.e., the blend of supply and demand) on specific trade lanes.
A recent paper by the Federal Reserve of St. Louis, looking at both containerized and bulk freight, found that around half the recent increase in shipping rates was due to “standard supply and demand forces, while the remaining is the result of disruptions in international shipping”.
Latest Value
We consider a four-week trailing average in the CCFI blended for US West Coast and US East Coast routes. The combination allows us to smooth for short-term considerations (e.g. temporary port closures) and redirections via the Panama Canal.
On that basis rates have continued to reach new highs, with the combined index in the four weeks to January 14, 2022 having increased by 9.0% since the start of December and by 95.7% compared to the same period of 2021. That would suggest little loosening of the supply and demand balance heading into the lunar new year. A sustained downtrend would signify a marked reduction in near-term pressures on the Transpacific shipping industry.
Also Consider
There are a variety of container shipping rate measures including traditional assessed-rates including S&P Global Platts and Drewry as well as exchange-style pricing from NYSHEX and Xeneta among others.
Typically, access to those prices requires commercial relationships. Furthermore, it should be noted that the rates from those sources may not be consistent with each other in covering a variety of terms (e.g., with- or without surcharges) and timeframes (e.g., spot- or future operations).
Less timely but more complete data for prices can also be drawn from national producer price indices (PPI) such as that published by the US Bureau of Labor Statistics. Such measures also provide a more realistic guide to costs actually faced by businesses rather than openly quoted shipping rates.
Ocean Handling Times
Key Characteristics & Sources
Flexport’s Ocean Timeliness Indicator assesses the time taken to ship containers from “cargo ready” at suppliers in Asia to their departure from ports in North American (Transpacific Eastbound, or TPEB) and Europe (Far East Eastbound).
Data is published on a weekly basis with an aggregate number of days shown. For this analysis we look in more detail at the first stage of the TPEB from the cargo ready date at Asian factories and warehouses to the ports in Asia where the voyage to North America starts. Data is smoothed via a four-week average and shown as a rebased index (February 2020 = 100).

Reason for Tracking
The data provides a measure of congestion within ocean logistics networks with an increase in shipping times representing bottlenecks in the process before the ocean voyage starts. The data is somewhat backward looking—total transit times can only be assessed once they are completed—though upward or downward trends are instructive.
Latest Value
Figure 8 shows there are some sign of improvements at the earliest stage of the journey—i.e., through arrival to the port in Asia—which has declined by around 7% since its peak in mid-November as of the four weeks to the second week of January. A steady move downwards in the measure over several weeks would provide a sign of declining bottlenecks in the shipping network.
Also Consider
Shipping vessel activity can be tracked directly using vessel Automatic Identification System data, with aggregations by route and all vessel types. That would not provide, however, notions of pre- / post-shipping timeliness or allow for unloading by port (e.g. a TPEB route may include several US West Coast stops).
Bringing it All Together - the Flexport Logistics Pressure Matrix
There’s a profusion of all-in-one measures of logistics network or supply chain stress, most recently including a global barometer assessed by the New York Federal Reserve. Combining the measures already outlined could run into compositional, sampling and combinatorial challenges.
We instead provide simple heatmaps of our datasets clustered between demand-side measures (sentiment, spending and inventory measures), and activity measures (freight handling, rates and timeliness).
The tables below together form the Flexport Logistics Pressure Matrix (LPM) which summarizes the data discussed above. They are colorized where red indicates system stress (e.g., more activity on the demand side or increased delays in deliveries) while green indicates less stress. The colors are based on the period from 2019 to date, with 10 color bands in total.
A steady shift in colors from red to green, or vice versa, indicates an establishing trend while minor variations (e.g., light green to yellow) indicate little significant change from month to month.
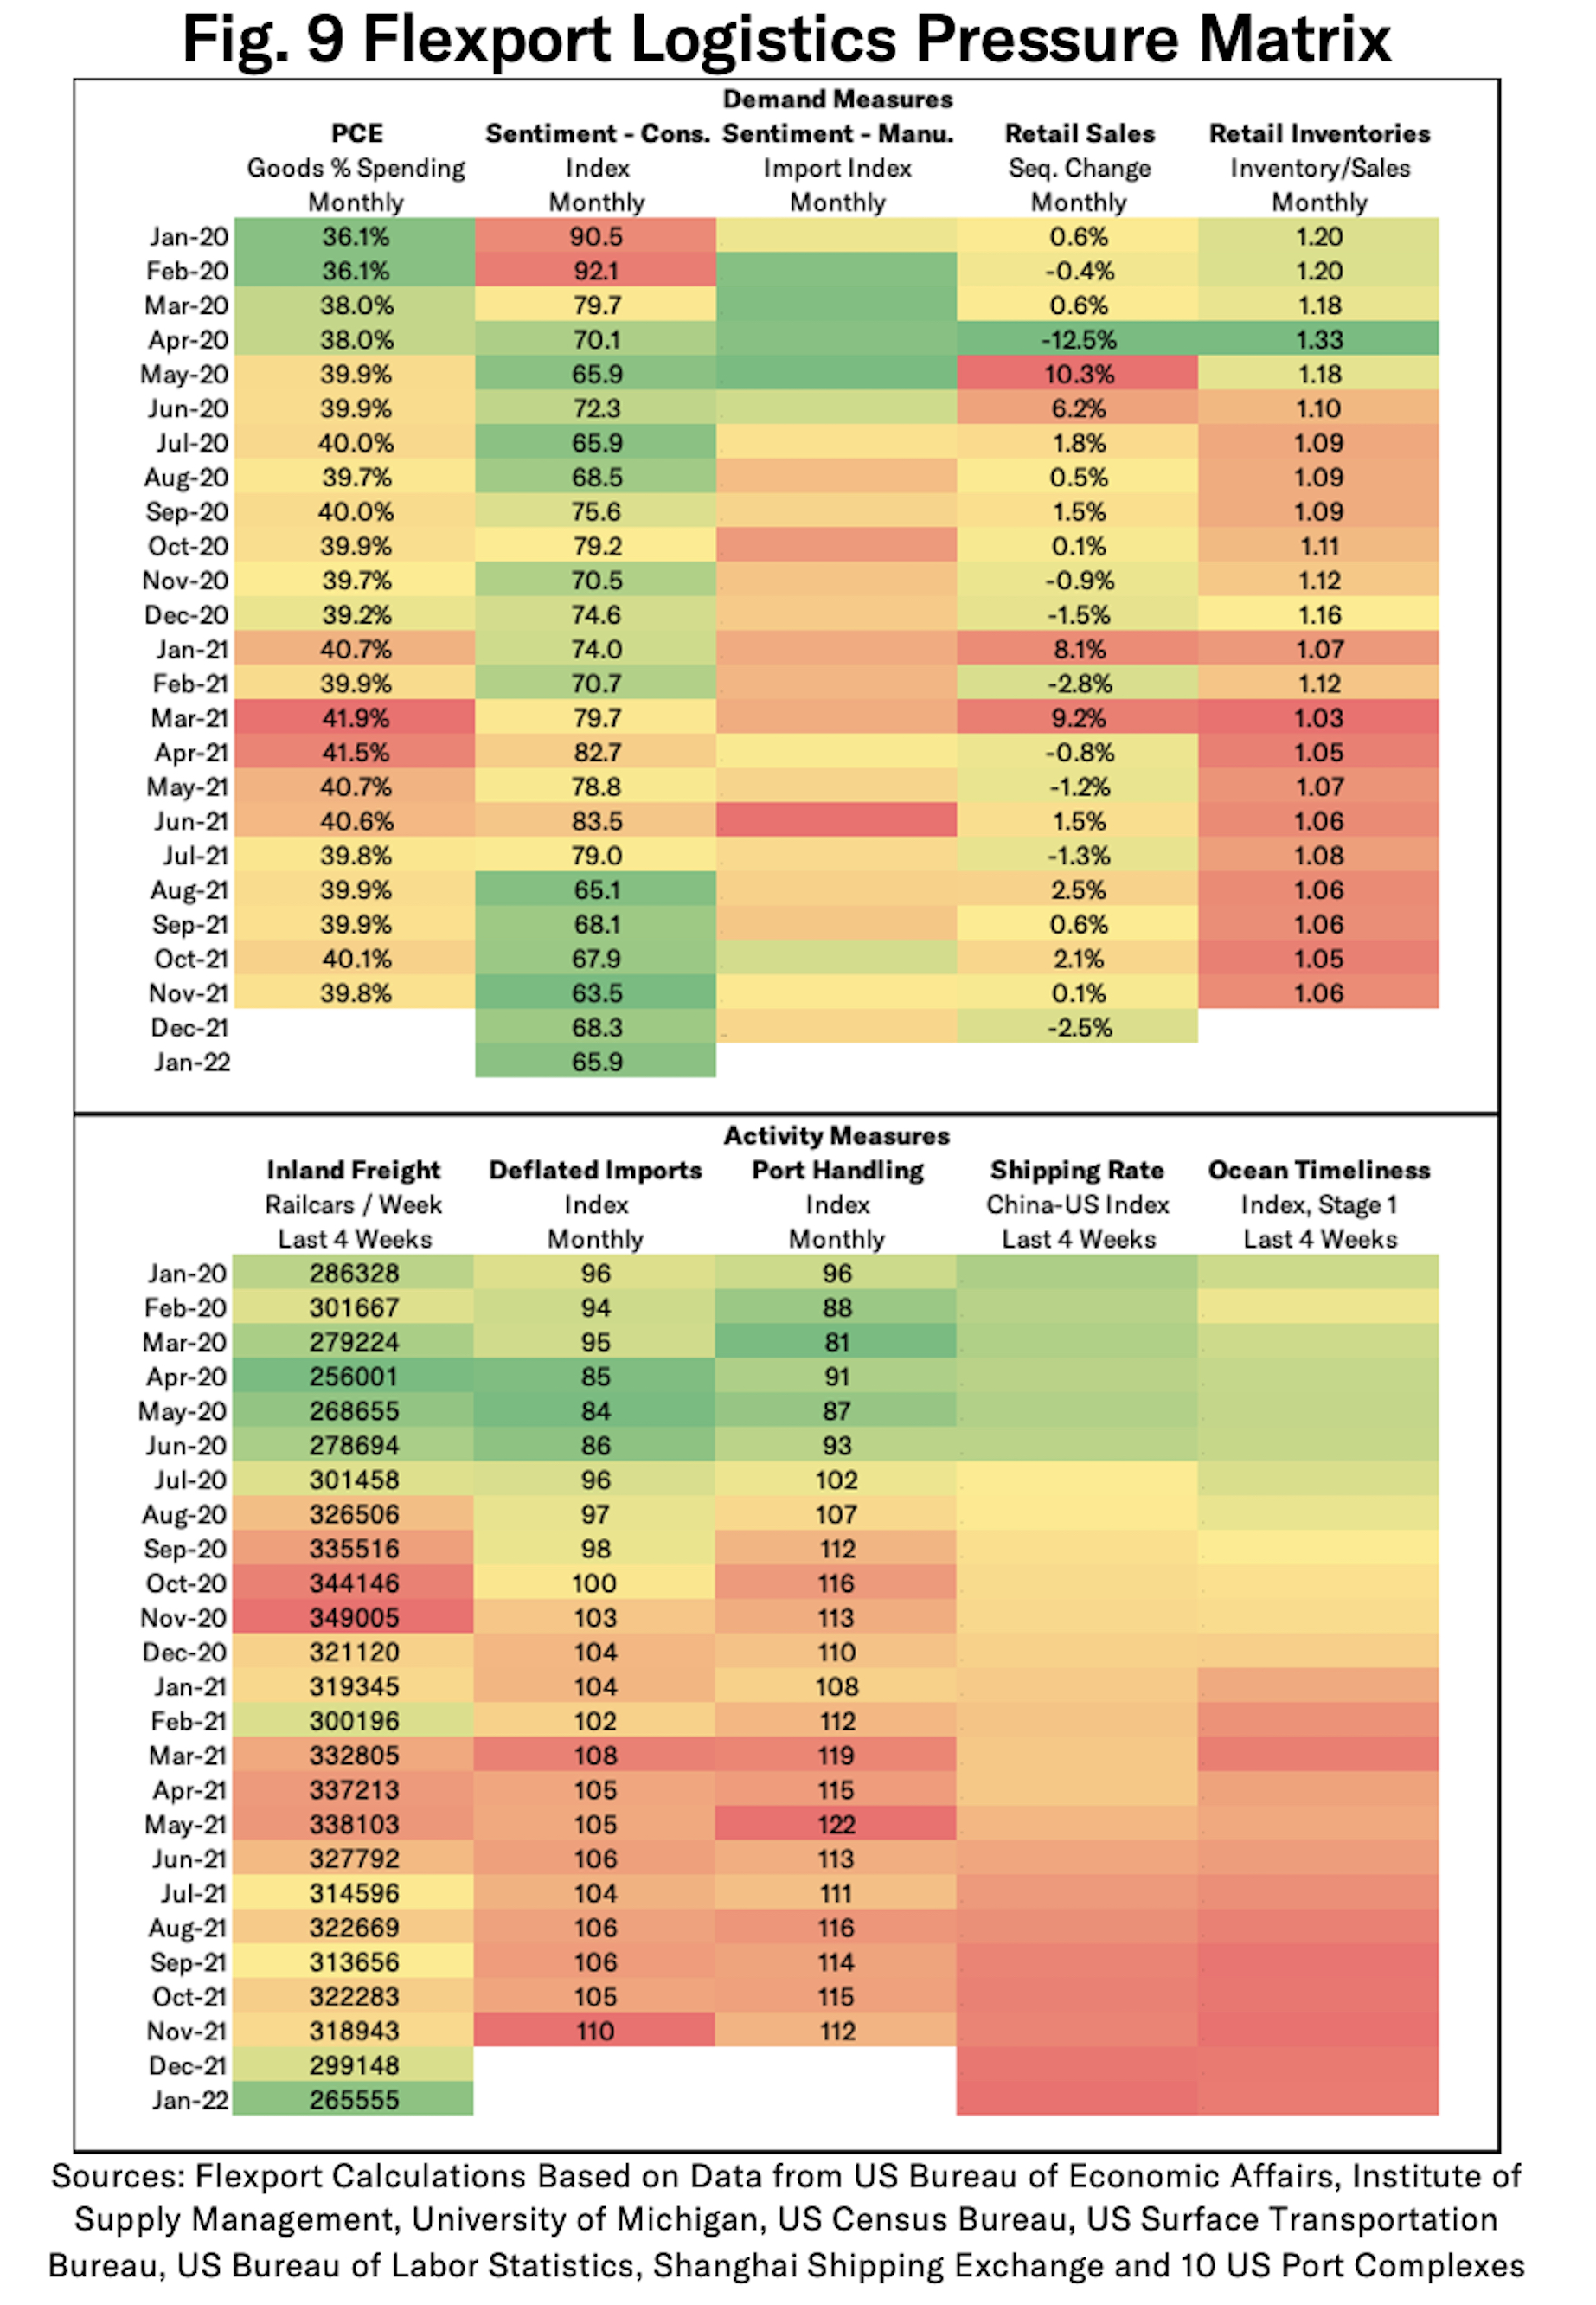
It’s notable that most measures remain in firmly stressed territory with the exception of consumer sentiment (which is becoming worse, indicating less demand in the future) and inland freight. The latter may reflect emergent bottlenecks hence less activity. The heaviest signs of stress are shown by retail inventories, deflated imports and (more recently) shipping rates and the ocean timeliness. Ongoing updates of the Flexport Logistics Pressure Matrix will be available at flexport.com/research.
Disclaimer: The contents of this report are made available for informational purposes only and should not be relied upon for any legal, business, or financial decisions. Flexport does not guarantee, represent, or warrant any of the contents of this report because they are based on our current beliefs, expectations, and assumptions, about which there can be no assurance due to various anticipated and unanticipated events that may occur. This report has been prepared to the best of our knowledge and research; however, the information presented herein may not reflect the most current regulatory or industry developments. Neither Flexport nor its advisors or affiliates shall be liable for any losses that arise in any way due to the reliance on the contents contained in this report.
About the Author


