

September 14, 2022
Santa Claus is Coming to Town Early - Toy Inventory Strategies


How have toy makers reacted to supply chain disruptions over the past two years? Is there evidence of a shift in activity patterns for this highly seasonal industry? Using corporate financial data, this report finds there’s been a surge in toy inventories. A review of corporate earnings calls finds the inventory build-up is the result of deliberate actions by manufacturers and retailers, who are seeking to avoid the shortages which bedeviled holiday shopping in 2020 and 2021.
Corporate inventory strategies are changing rapidly. As discussed in recent Flexport research, there’s been a marked uptick in corporate inventory balances across many industries reflecting (a) a desire to resolve earlier shortages and (b) a slide in consumer demand.
This report takes a deep dive into the highly seasonal toy sector. We show how inventory growth is outstripping demand as the major toymakers try to avoid the seasonal stock-outs experienced in previous years.
Heading for the Sack - Increased Inventory Ratios
Few supply chains have as specific a timeframe constraint as the toy industry, both from a single-event perspective (Christmas gift-giving season in American and European markets) and in terms of specific products (also known as “hot-toys”).
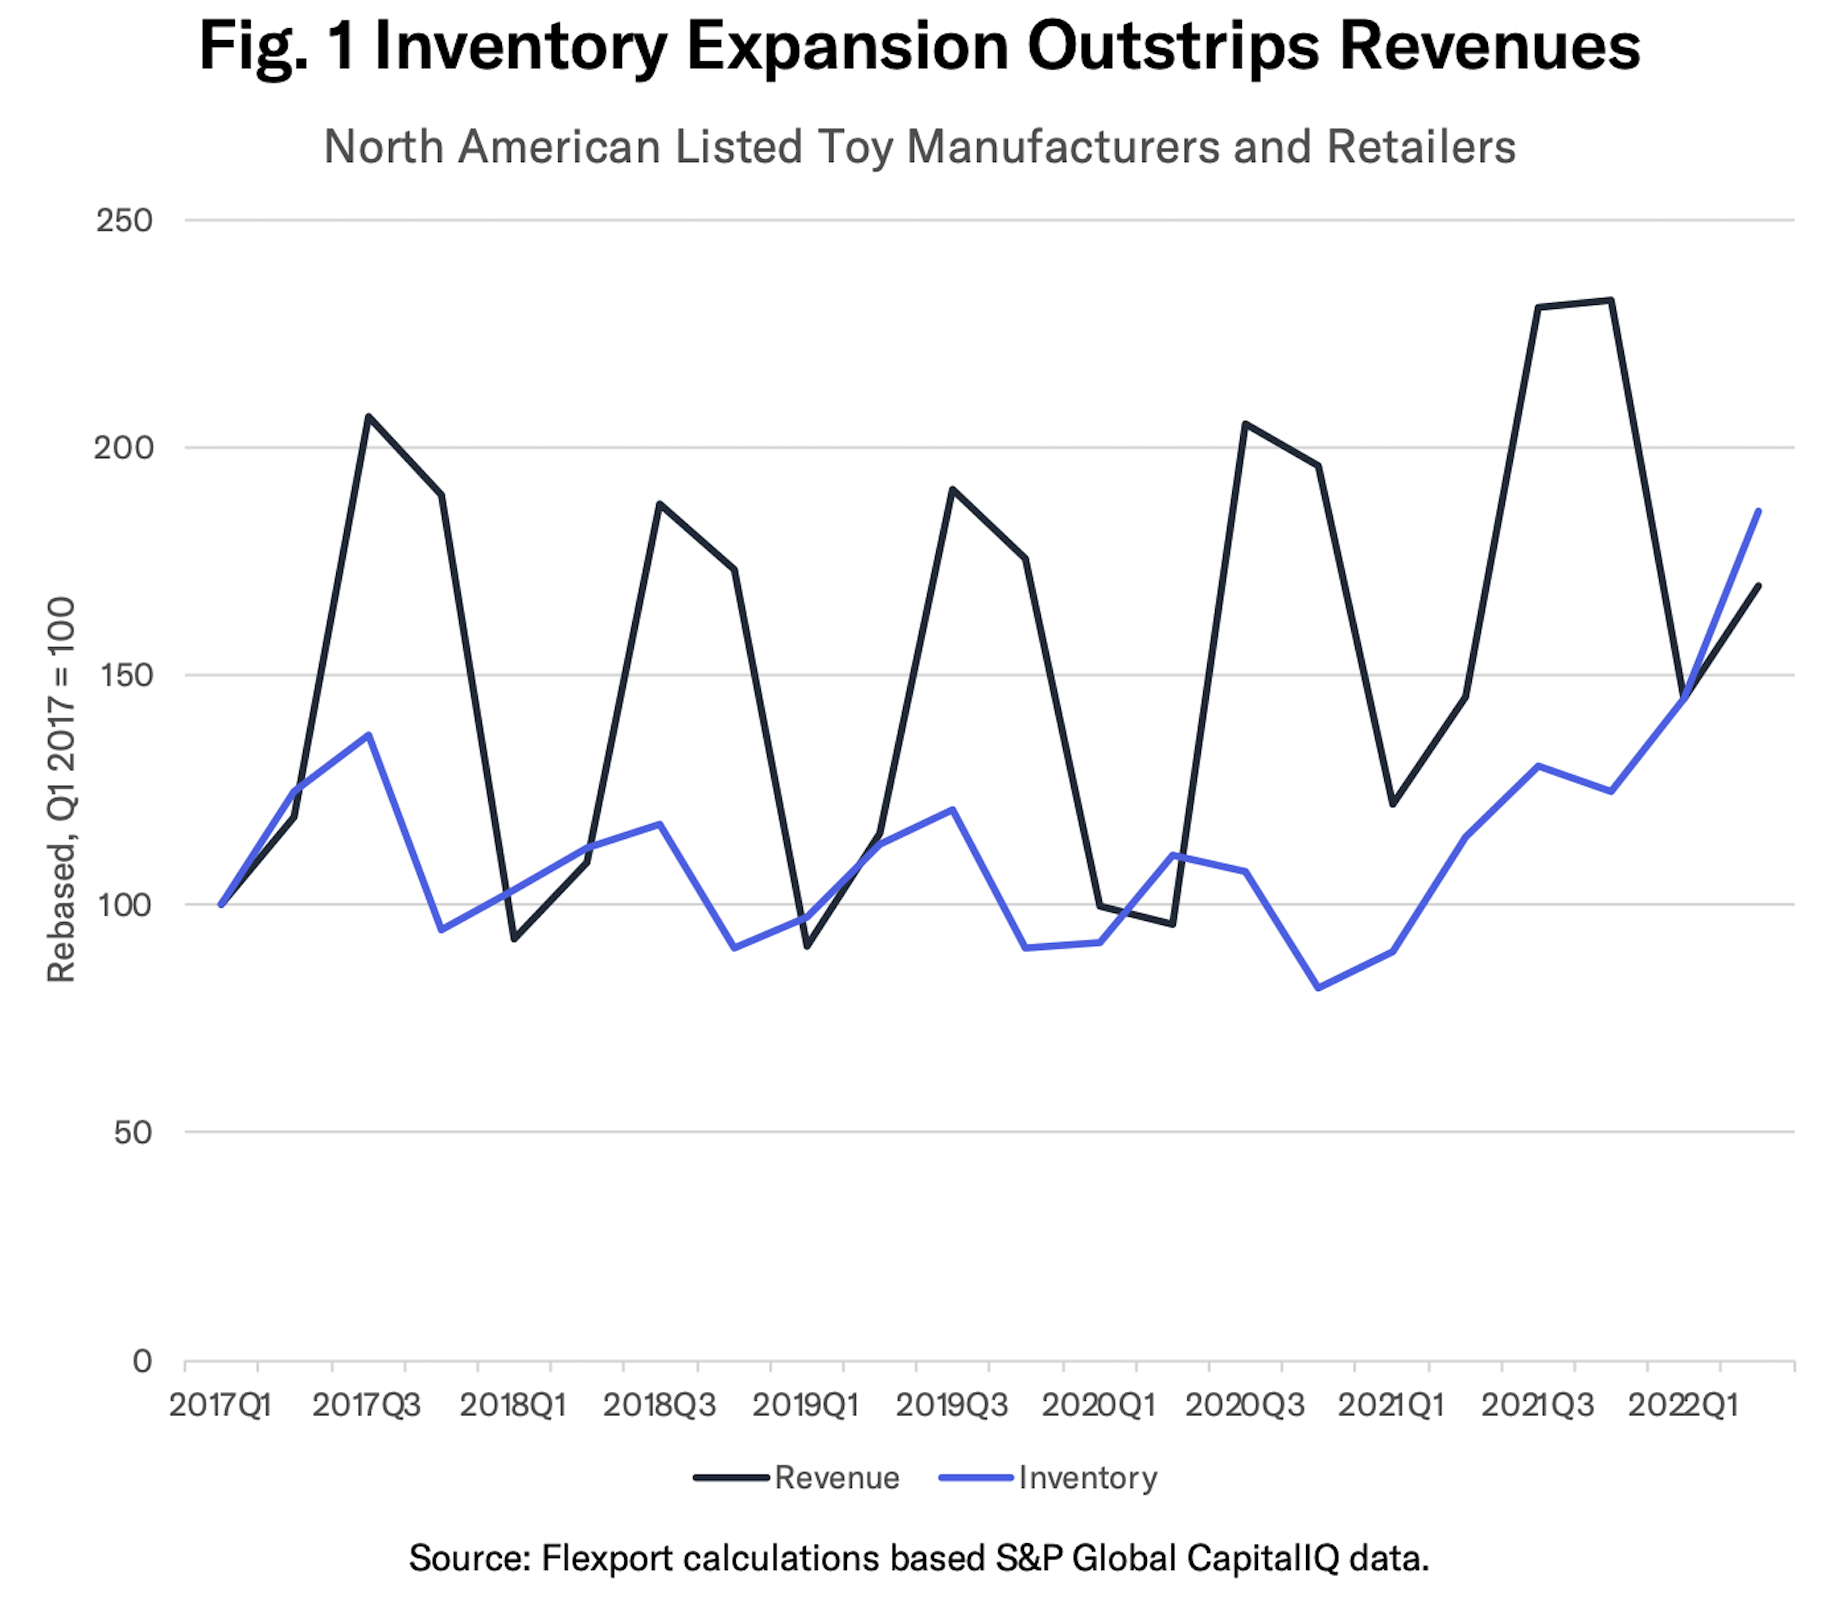
The seasonality can be seen in a significant swing in both revenues and inventories during the year. Figure 1 combines the financial data for six toy producers and retailers, rebased to Q1 2017 levels. Inventories have historically reached their peaks in Q2 and Q3 each year, in order to supply revenues which peak in Q3 and Q4.
It’s worth noting that Q3 (i.e. the three months to September 30) tends to represent peak revenues as toy wholesalers book their revenues to end-retailers—general retail stores and e-commerce platforms—that are outside the sample group. Retail sales of toys to consumers peak in November and December, as discussed in prior Flexport research.
The second pattern evident in the chart is the rapid acceleration of activity after Q3’20. That partly reflects the downturn and subsequent recovery from pandemic-related factory closures. Subsequent growth in sales may reflect the more widespread rise in consumer spending seen across the economy.
The expansion has continued through to 2022. Revenues in Q2’22 increased by 17% year over year in nominal terms. The rate of consumer price inflation in toys was just 1.9% in June 2022, suggesting a significant growth in real terms too.
The value of inventories surged 62% higher over the same period. The resulting inventory-to-sales ratio of 0.72x compares to 0.66x in the 2011 to 2019 period. For reference, the inventory-to-sales ratio for leisure goods companies more broadly reached 0.86x, in Q2’22, compared to 0.63x in 2011 to 2019. That may indicate toy firms have had fewer challenges in managing their supply chains than other leisure firms, which include sports goods retailers among others.
Early Loading to Avoid Later Problems - Toy Trade Activity
So, why have retailers increased their inventories so aggressively?
Flexport’s review of earnings conference call transcripts for eight global toy and video game manufacturers and retailers makes the reason plain. Six of the eight firms have stated they deliberately increased their inventories to (a) avoid repeating the shortfalls linked to slower-than-expected shipping in 2020 and 2021 and (b) reduce their exposure to continuing cost inflation.
All six of those firms have also increased their prices, citing confidence that toy buyers won’t want to disappoint their recipients. The continued increase in revenues, shown in Figure 1, suggests that price rises may not have deterred shoppers during the off-peak season.
There’s evidence of continued expansion in the shipping of toys in U.S. seaborne import data. Historically, as shown in Figure 2, there’s a peak in such imports in October each year, with a ramp-up starting in July.
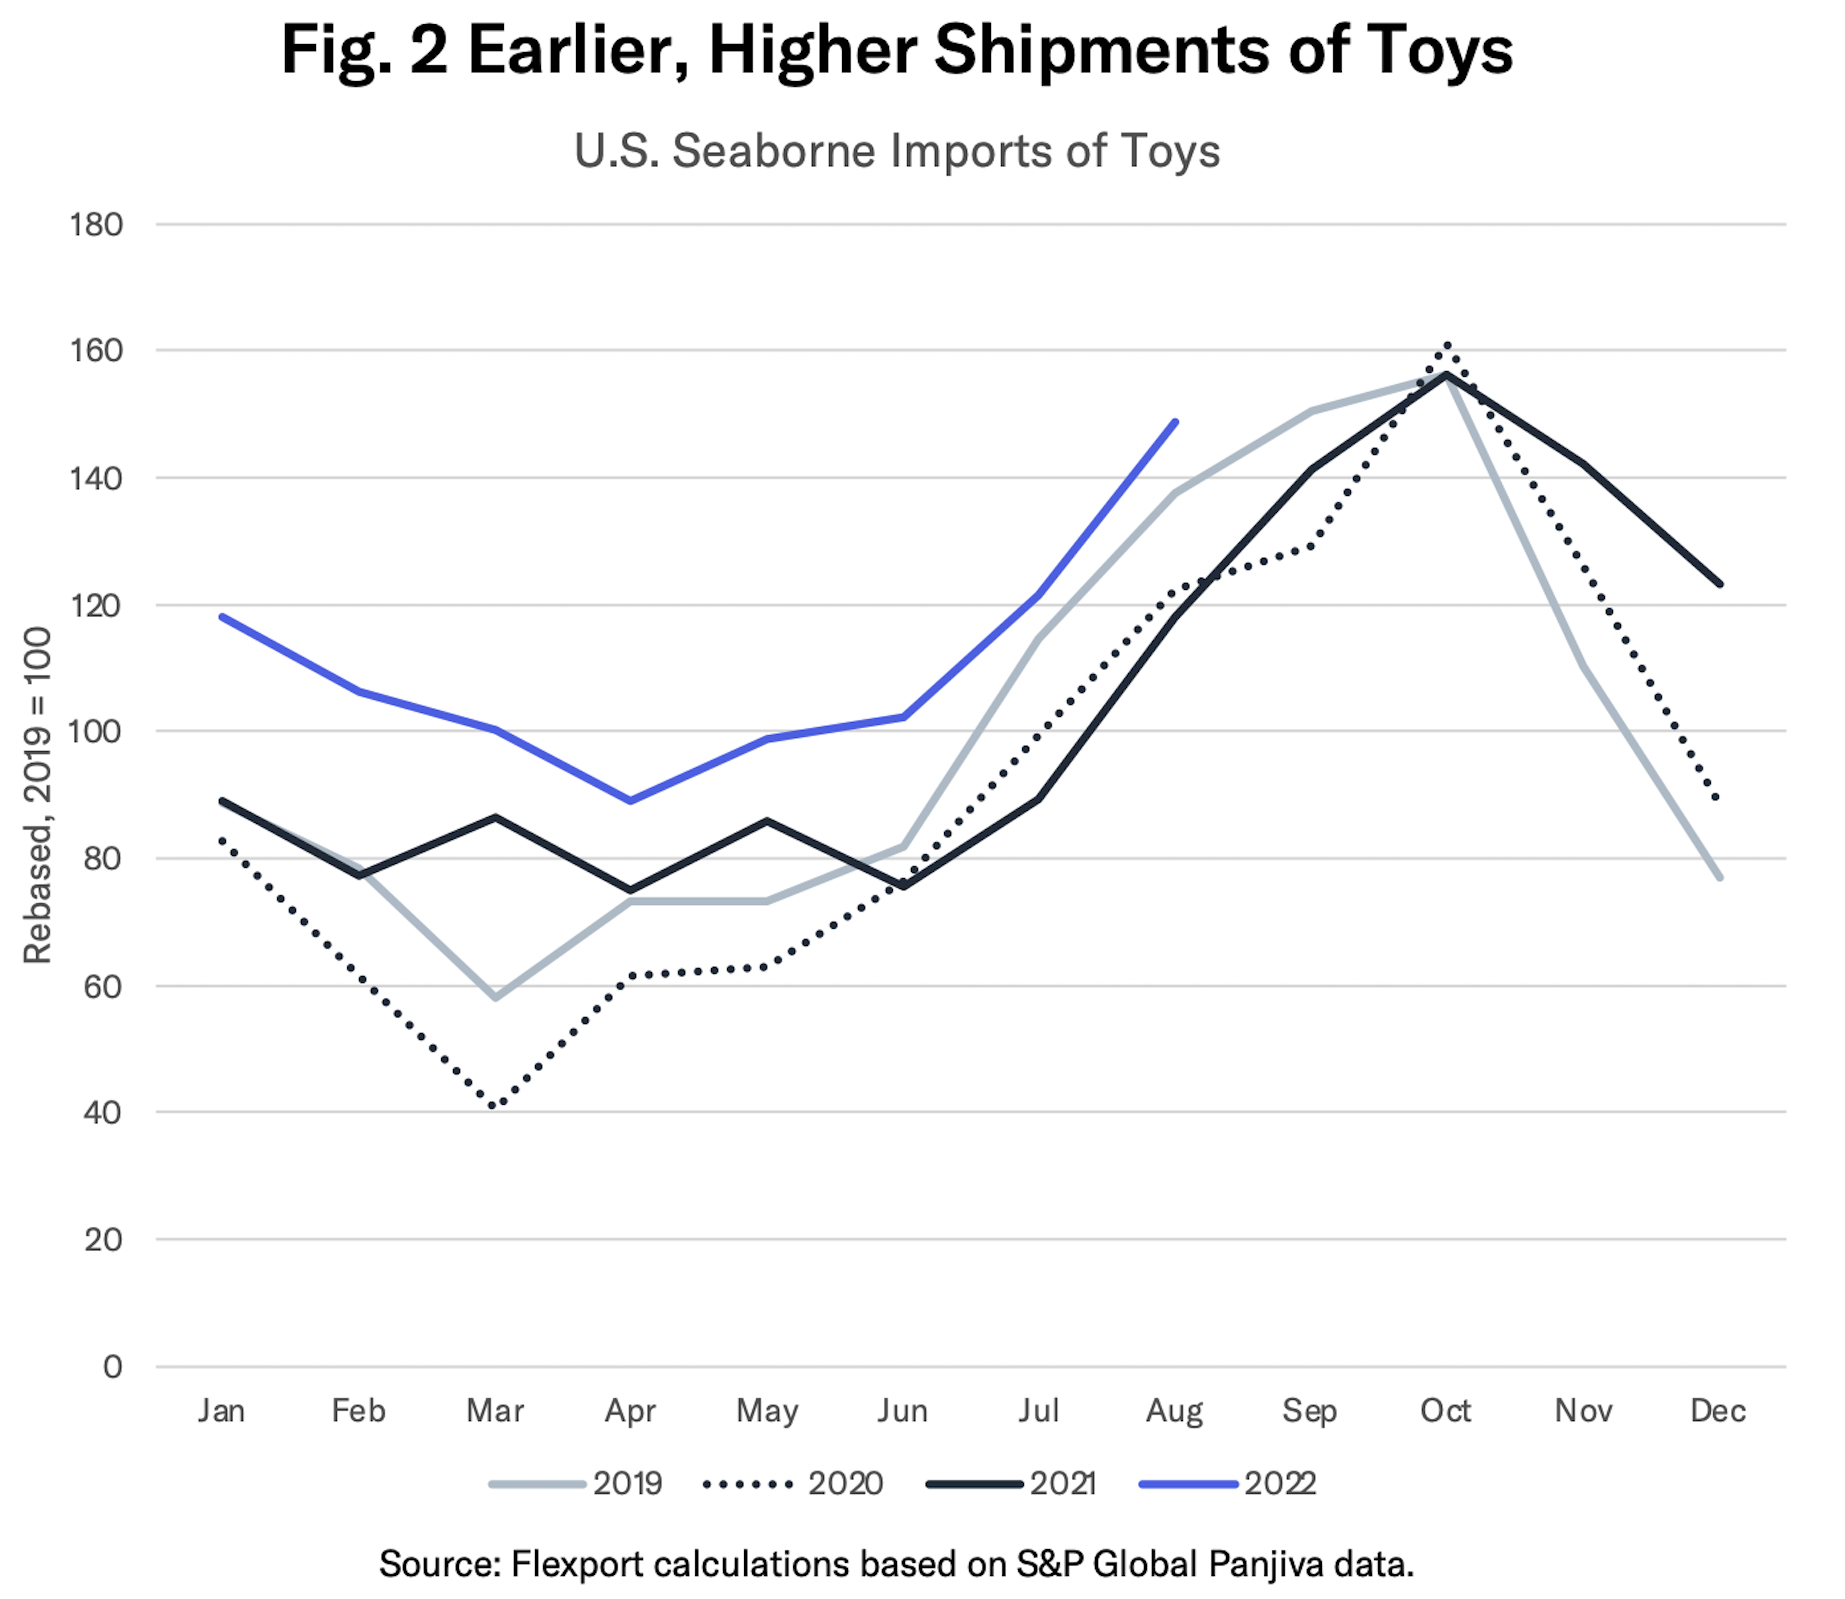
Seaborne imports in July 2022 increased by 36% year over year, while those in August increased by 26%. It’s worth noting that imports in July and August were also 6% and 8% higher respectively than the same periods of 2019. That may suggest retailers are anticipating increased sales, as well as digging out from earlier shortages.
Electronics-based toys, including video game consoles, also face the additional challenge of the availability of key components, particularly semiconductors. According to one of the big three console makers, “conditions are improving,” leading the firm to “front-load shipments for the year-end shopping season.”
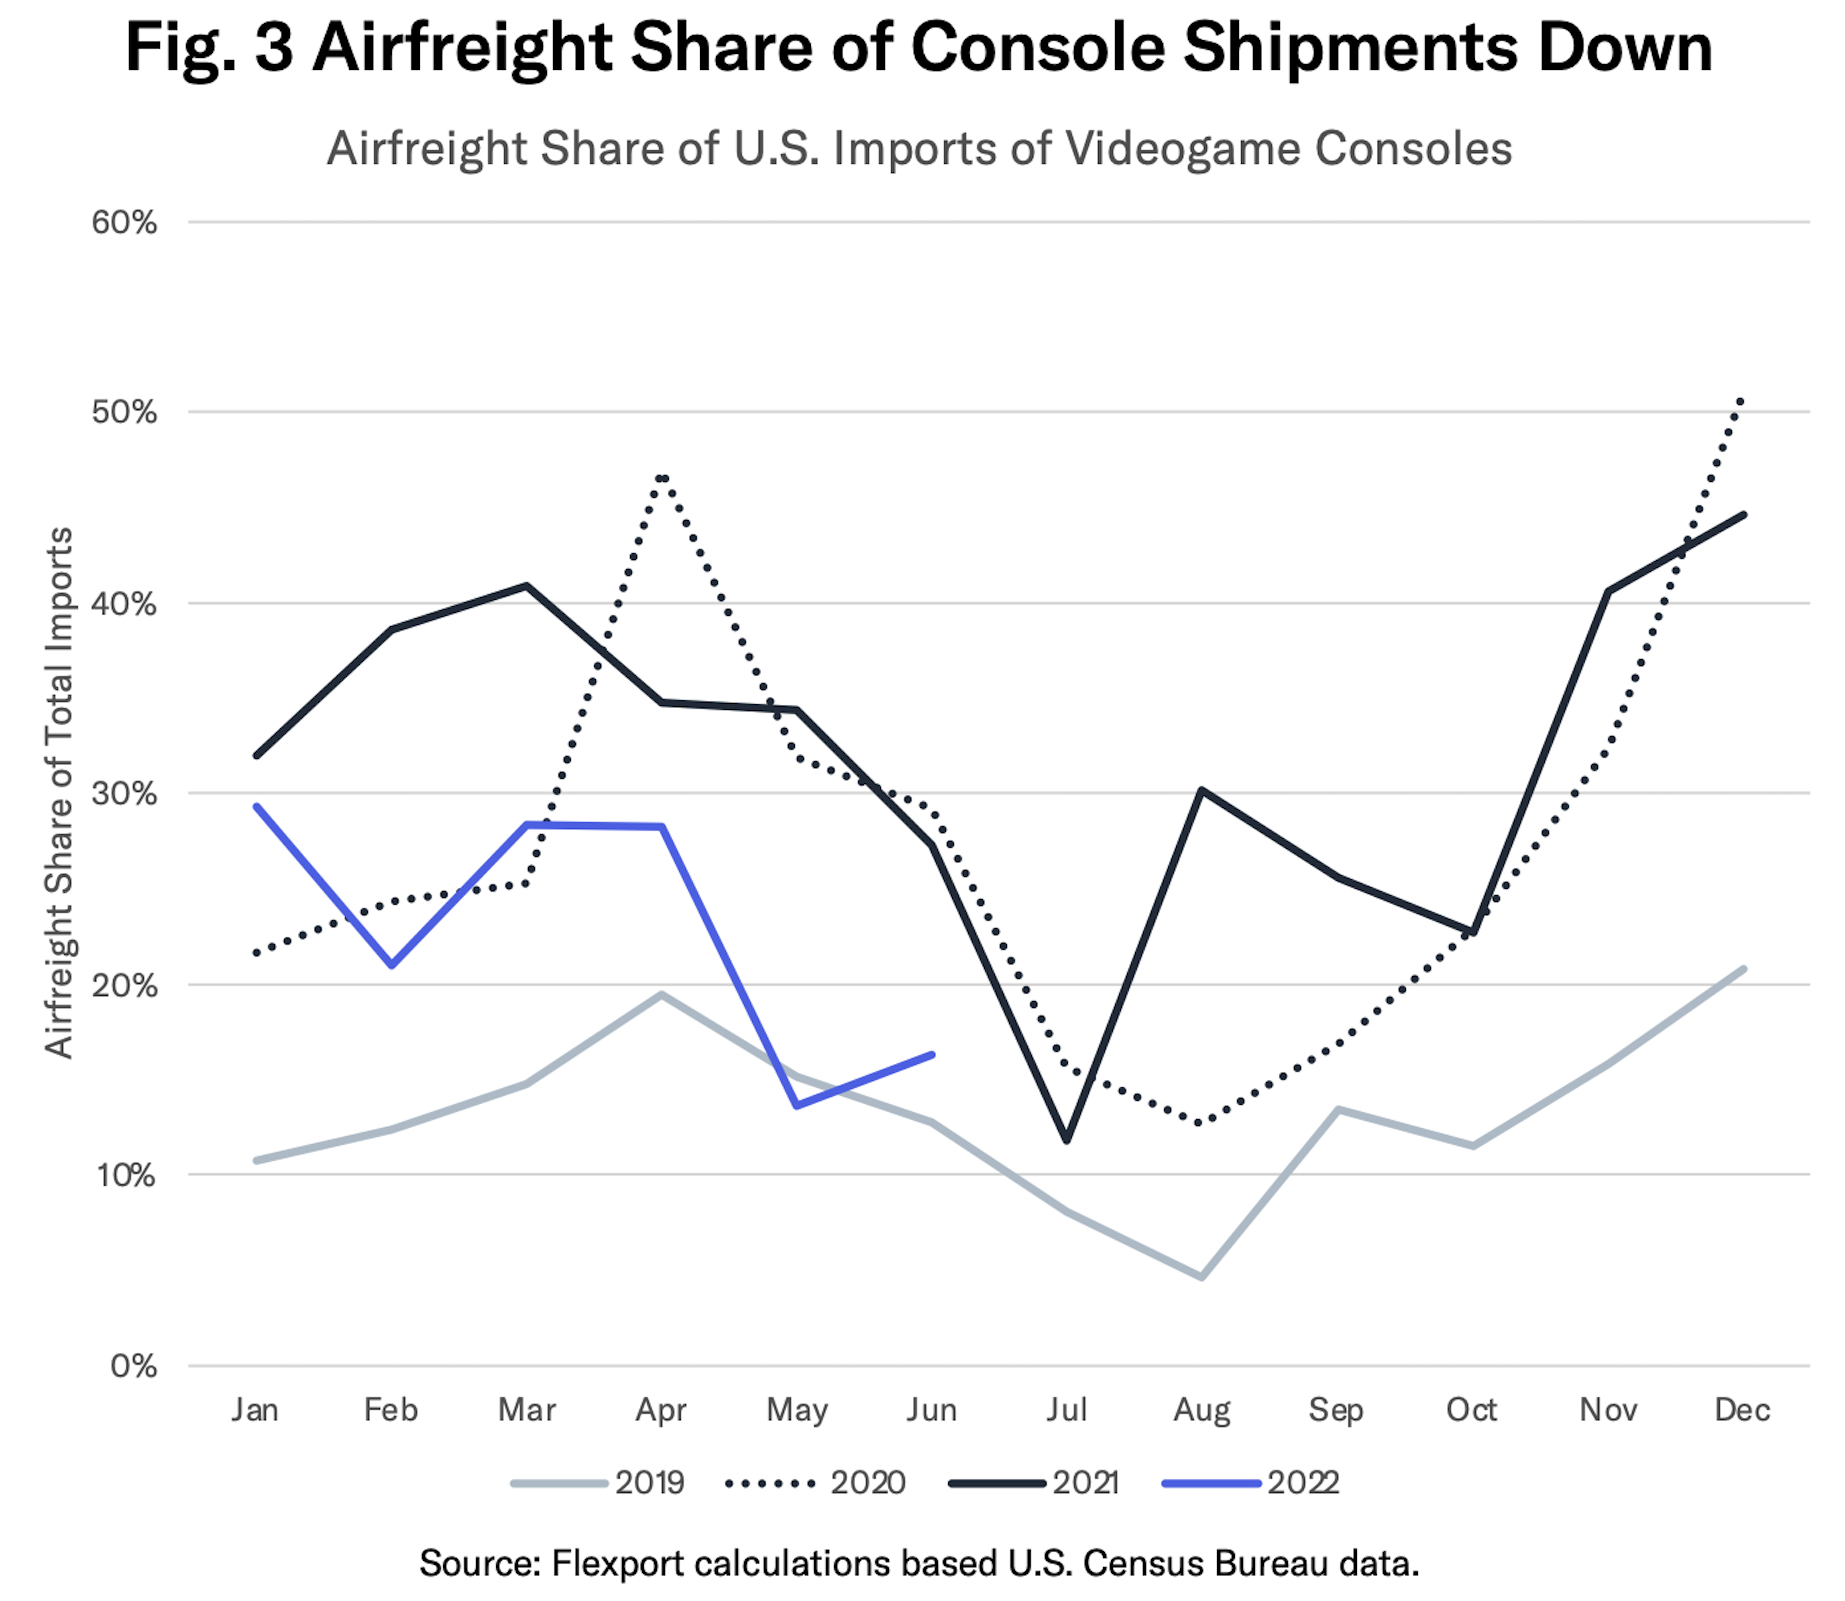
Electronics toys producers historically make more use of airfreight at times of parts shortages, as seen in 2021 in Figure 3. As shown in Figure 3, the share of airfreight in Q2’22 in U.S. imports of video game consoles was 19%. That compared to 32% in Q2’21, perhaps indicating less need for parts-related rushed shipments, though it is still above the same period in 2019. The share of airfreight may increase later in the year. Historically there is a seasonality to shipments as new console models become available.
In conclusion: The toy sector provides a case study for the evolution of inventory balances and strategies in the wake of the pandemic. Corporate financial data shows that inventory growth has outstripped revenues markedly in the past few quarters, leaving the inventory-to-sales ratio well above historic levels. A review of corporate commentary shows this is a deliberate strategy to avoid a repeat of prior years’ stockouts.
Disclaimer: The contents of this report are made available for informational purposes only and should not be relied upon for any legal, business, or financial decisions. Flexport does not guarantee, represent, or warrant any of the contents of this report because they are based on our current beliefs, expectations, and assumptions, about which there can be no assurance due to various anticipated and unanticipated events that may occur. This report has been prepared to the best of our knowledge and research; however, the information presented herein may not reflect the most current regulatory or industry developments. Neither Flexport nor its advisors or affiliates shall be liable for any losses that arise in any way due to the reliance on the contents contained in this report.
About the Author


