January 12, 2016
A New Way to Calculate Carbon Emissions for Freight
A New Way to Calculate Carbon Emissions for Freight
Flexport values visibility. While most other freight forwarders conduct business using filing cabinets and fax machines, our online app offers a map showing your shipments moving in real time. It recently occurred to us that we can offer visibility in yet another way: How much carbon emissions are generated by each shipment.
So we were excited when the Harvard College Consulting Group, a student-run nonprofit, approached Flexport to develop a calculator for carbon emissions. We’re now in the process of taking the research from this collaboration and building it as a tool for our clients.
More global companies are interested in reducing their carbon footprints. We want to help. Just as Flexport is able to optimize your supply chain on the basis of price and timing, we’ll be able to give you the ability to select different shipping options to minimize carbon emissions.
Companies who ship with Flexport will soon have the option to calculate the carbon emissions generated from shipments segmented into ocean, rail, and air legs. “To improve, you first have to report,” says Diego Saez Gil, CEO of Bluesmart, the smart luggage company. “As a business that thinks deeply about how to have a positive impact on the world, we’re excited to be able to use this tool from Flexport.”
The research was undertaken by a collaboration between Flexport’s data science team and the Harvard College Consulting Group. Isaac Xia, a double-major in computer science and economics, was the case leader of a team of six Harvard undergraduates. “We were able to dig into a lot of different data sources to refine our model,” said Xia. “There’s a lot of interesting work involved to build this.”
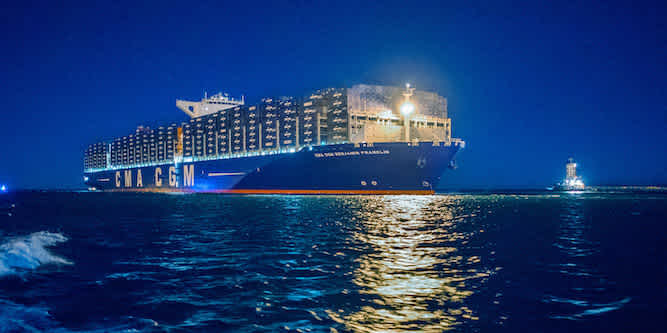
We know that carbon emissions from shipping are lower by ocean than by air. Our model can now quantify that difference. Here’s something we’re able to quantify: 5000 kilograms of goods (or one TEU) traveling by container ship from Shenzhen to Los Angeles would generate 2 tons of carbon. The same figure for delivery by airplane is 35 tons, a nearly 18X difference. We also see the importance of vessel selection: Newer planes and ships are dramatically more efficient than older vessels.
Now here’s a bit more about the model.
We calculate the carbon emissions associated from shipments from the following factors: weight, volume, route, type of vessel, source and destination. We determine container fill percentage and utilization rate if the shipment travels by ocean or by air. Given these inputs, we’re able to determine the total emissions attributed to that shipment over its journey. We model the logistics of moving a shipment to match real world logistics as closely as possible, including segmenting different types of vessels by fuel efficiency, refining the model based on actual trade lanes used, and accounting for probable vessel utilization rates. Over the next few months we’ll continue to refine our model before we make this available to our clients.
Flexport is uniquely positioned to offer this service to companies moving freight internationally. We collect and structure data on almost every aspect of each shipment we manage. That means we already have all the relevant inputs for a model on carbon emissions in our database, so feeding that model real-time data becomes relatively simple.
Other forwarders don’t have structured data about the vessels transporting their freight. In many cases, they don’t even have data on the weight of the cargo they are moving. Without this data, it becomes a very manual task to calculate the carbon emissions of a shipment—the cost of which would likely not justify the effort.
In that sense, this new carbon emissions model illustrates one of our core themes at Flexport: When you bring an old-school industry online for the first time, you get more than a digital copy of the status quo. New possibilities emerge. Whether it’s calculating carbon emissions, tracking products down to the SKU level, or providing recommendations for inventory stock allocations, our use of structured data allows us to do things that were impossible in the analog world where traditional freight forwarders operate.
The analysis was led by Patrick Steigler, lead data scientist at Flexport, and the following students at Harvard: Isaac Xia, Belino Xhafa, Gilbert Wassermann, Joanna Chung, Luke Kramer, and Kevin Lee. Researchers interested in accessing our model or to suggest improvements should email Dan Wang: dan@flexport.com.


