

October 9, 2023
Bond Market Intimidation - Flexport Weekly Economic Report

Bond Market Intimidation - Flexport Weekly Economic Report

Last week longer-dated Treasury yields hit highs not seen in over a decade. Longer-term yields are the transmission mechanism by which tighter monetary policy is likely to impact the economy and these moves bring us closer to impact.
In Focus - High-Yield Treasuries
Often we focus on policy variables, such as the Fed Funds rate at the heart of U.S. monetary policy. Yet that rate generally applies to limited borrowing between banks. The impact on the economy depends on how the policy rate is transmitted to the other market-determined interest rates that drive borrowing costs for businesses, home buyers, and consumers.
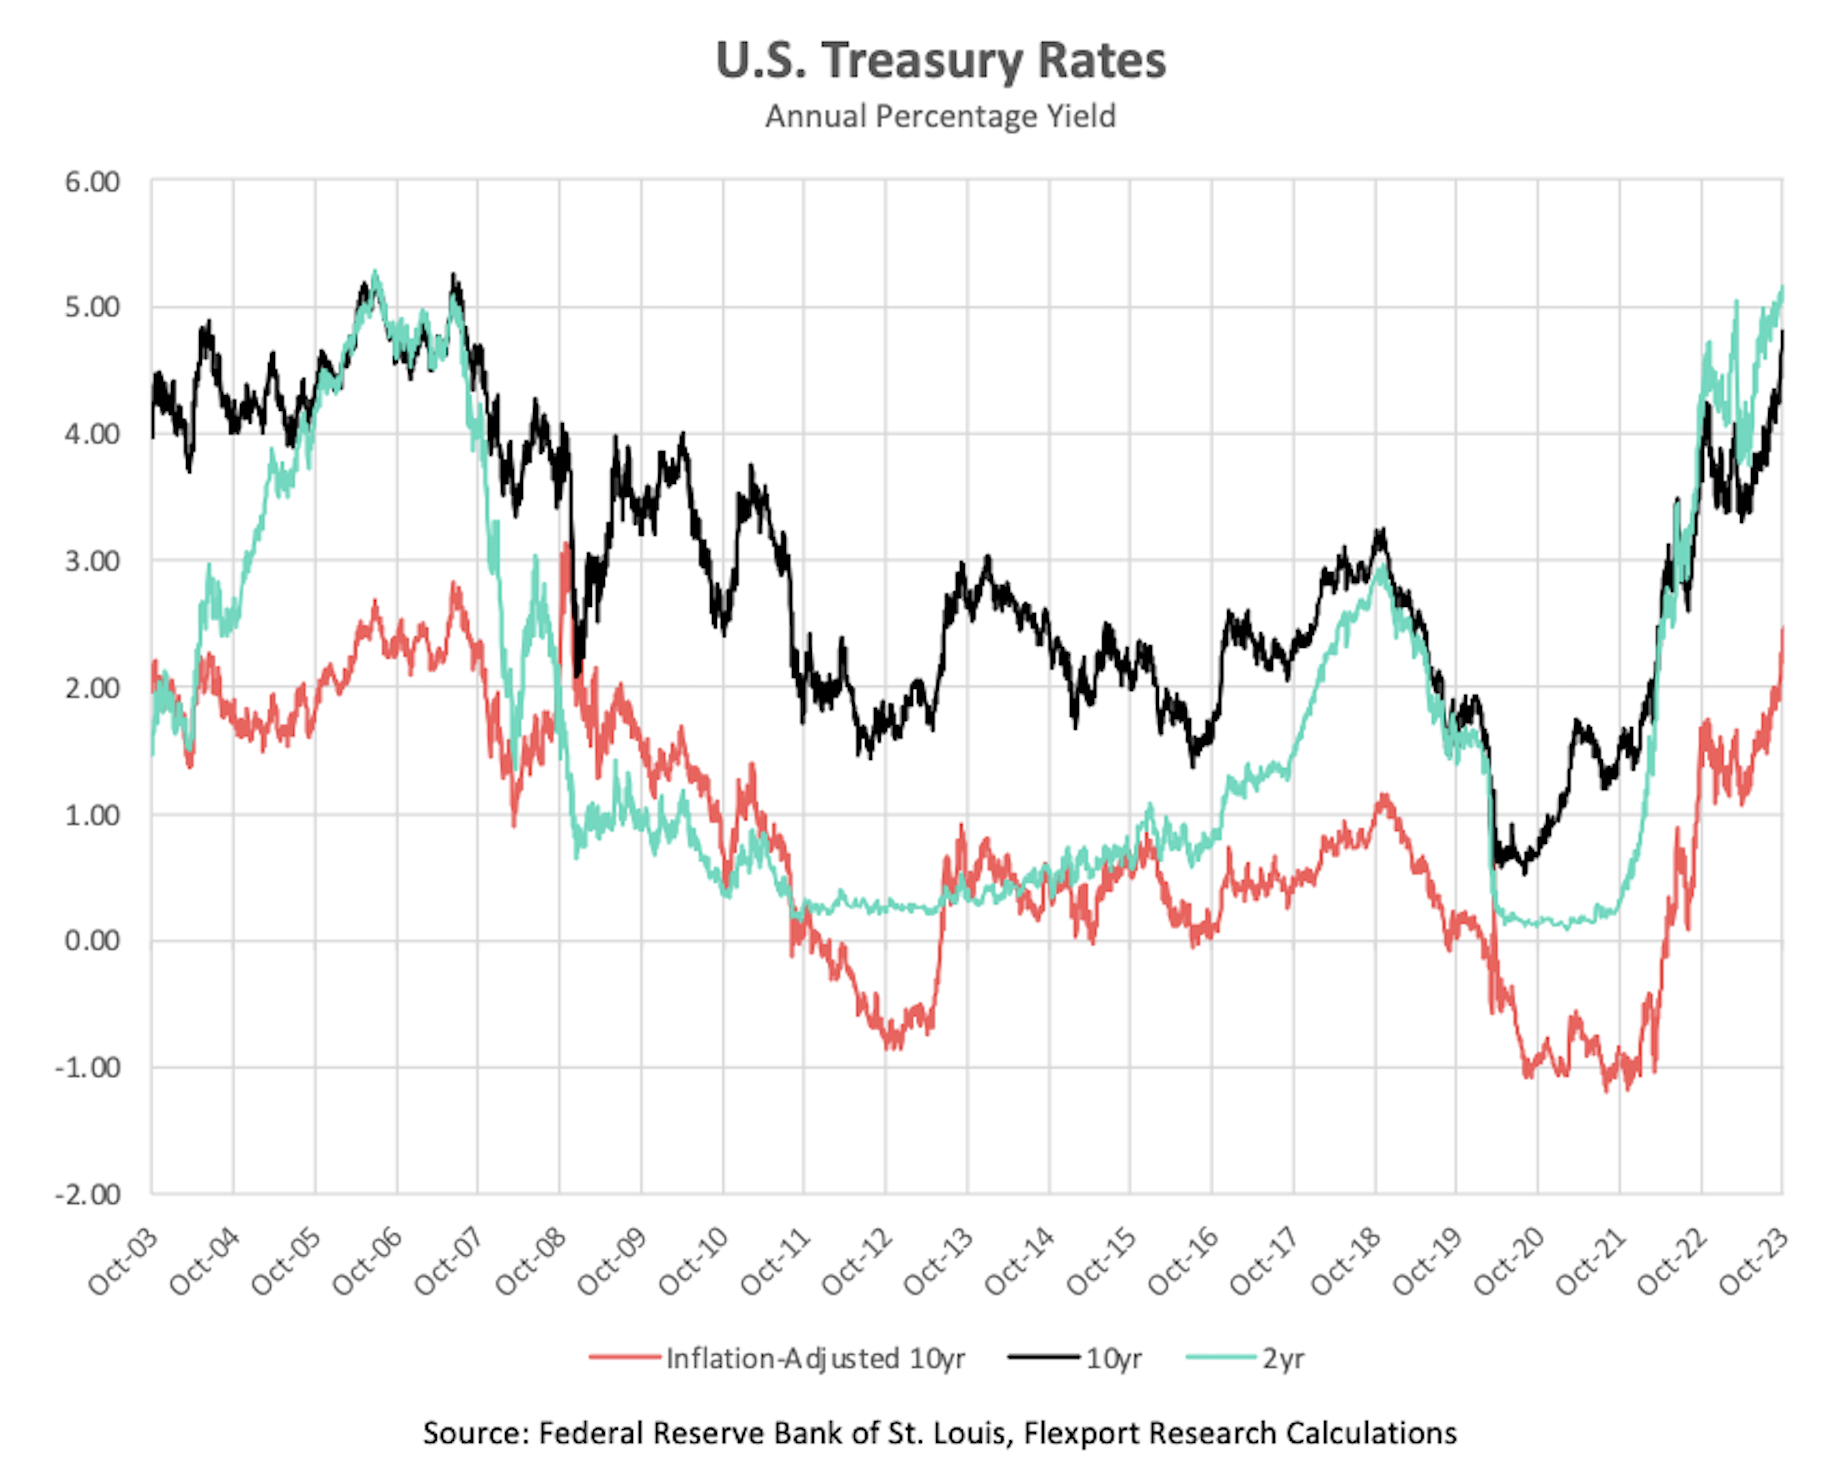
U.S. Treasury borrowing often serves to provide benchmark rates for the massive credit market, as they are (usually) seen as risk-free. The chart tracks rates for two different maturities: the 2-year (green) and 10-year (black). Those are both nominal rates. Thus, the real yield on a 10-year bond bought at Friday’s 4.80% rate will be diminished by whatever inflation there is over the next ten years.
The final, red line on the chart shows this real yield for the 10-year bond. This is possible because the Treasury offers an inflation-protected security that compensates investors for inflation. As of Friday, it was promising a real 2.48% return over the next decade (implying an 2.26% average rate of inflation).
The chart shows two decades of rates for each series, which puts the recent sharp climb in rates in some historical perspective. The last time 10-year nominal rates were this high was August 2007. For the real 10-year yield, it was November of 2008.
These rates are set by investors buying and selling bonds. When bond prices fall, rates go up (and vice versa). Any explanation for how the rates are moving has to deal with these buy and sell decisions. Selling could be because of increased expectations of future rates or because alternative investments look better Or just because someone needed to cash in their bonds.
Whatever the reason, bond prices have fallen dramatically. The long time span of the chart conceals how sharp recent movements have been. The 10-year real and nominal bond yields have risen 100 basis points each (1 percentage point) since July.
The ever-quotable James Carville once said: “…if there (were) reincarnation…I would like to come back as the bond market. You can intimidate everybody.”
Three reasons why this big fall in the bond market and rise in yields are intimidating:
The longer-term rates really set the pace of economic activity. They act as a hurdle rate for business investment and are closely tied to mortgage rates. When they go up and stay up, the economy is likely to slow.
When nominal 10-year rates were last this high, around Q4 of 2008, U.S. public debt was just under 75% of GDP. Now the figure is just under 120% of GDP. That debt rolls over regularly. When rates go up, interest payments can increase dramatically, potentially crowding out other federal spending.
Because soaring bond rates correspond to collapsing prices, the recent experience has met large capital losses for investors who may have thought of government bonds as safe investments. The balance sheet effects may take some time to reveal themselves.
When Fed officials said rates would remain higher for longer, one motivation was surely to talk up longer-term rates so as to slow the economy. If so, recent bond market moves suggest the approach will likely rate as effective.
You can now receive the Weekly Economic Report straight to your inbox every Monday by signing up here.
Latest Flexport Metrics & Research
This week we’ll be looking at the recent revisions to the U.S. Bureau of Economic Analysis’s personal consumption expenditure data, as well as the yen, the BOJ’s monetary policy and trade.
Economic Developments
The U.S. added 336,000 new jobs in September, surpassing expectations and increasing the likelihood of the Fed resuming monetary tightening after last month’s pause. The unemployment rate remained at 3.8%.
U.S. consumers appeared to pull back from spending on credit in August the most since the early months of the pandemic, but all of the decline was in non-revolving credit, which includes student loans. Seasonally-adjusted (but nominal) revolving credit increased 13.9% month-on-month. We wrote about this last month.
Euro area retail sales fell 1.2% month-on-month in August and were down 2.1% from a year earlier. Spending on gas, which dropped 3.0% from July, drove much of the decline, although e-commerce purchases dropped, as well.
Last week’s trade releases were, on the whole, less encouraging than they have been recently, although in Germany’s data there were signs of a potential rebound in China.
U.S. real imports decreased 1.9% in August, while exports rose by 0.1%. Imports of consumer and capital goods were the main contributors to the decline.
German exports were off 5.8% year-on-year in August. Exports to the US fell by 1.3% from July, while shipments to China increased 1.2%.
Mexico auto exports jumped again, rising 15.7% year-on-year in August, the most since March 2020 on a unit basis. It was the ninth straight month of growth by that measure.
Political Developments
Israel formally declared war on Hamas on Sunday following the attacks on Saturday morning. Oil prices were up 4% as of Monday.
For the first time in U.S. history, the Speaker of the House of Representatives has been voted out of office. He has yet to be replaced. The body will reconvene next Wednesday to vote on a successor.
Disclaimer: The contents of this report are made available for informational purposes only and should not be relied upon for any legal, business, or financial decisions. Flexport does not guarantee, represent, or warrant any of the contents of this report because they are based on our current beliefs, expectations, and assumptions, about which there can be no assurance due to various anticipated and unanticipated events that may occur. This report has been prepared to the best of our knowledge and research; however, the information presented herein may not reflect the most current regulatory or industry developments. Neither Flexport nor its advisors or affiliates shall be liable for any losses that arise in any way due to the reliance on the contents contained in this report.
About the Author


