

October 23, 2023
Strong Online Sales - Flexport Weekly Economic Report

Strong Online Sales - Flexport Weekly Economic Report

The monthly advance retail sales numbers for September showed continued strength, up 0.7% for the month in nominal terms and 3.0% for the year. We smooth the volatile series, account for inflation, and find particular strength in online business and weakness in home furnishings.
In Focus - Real Retail Sales
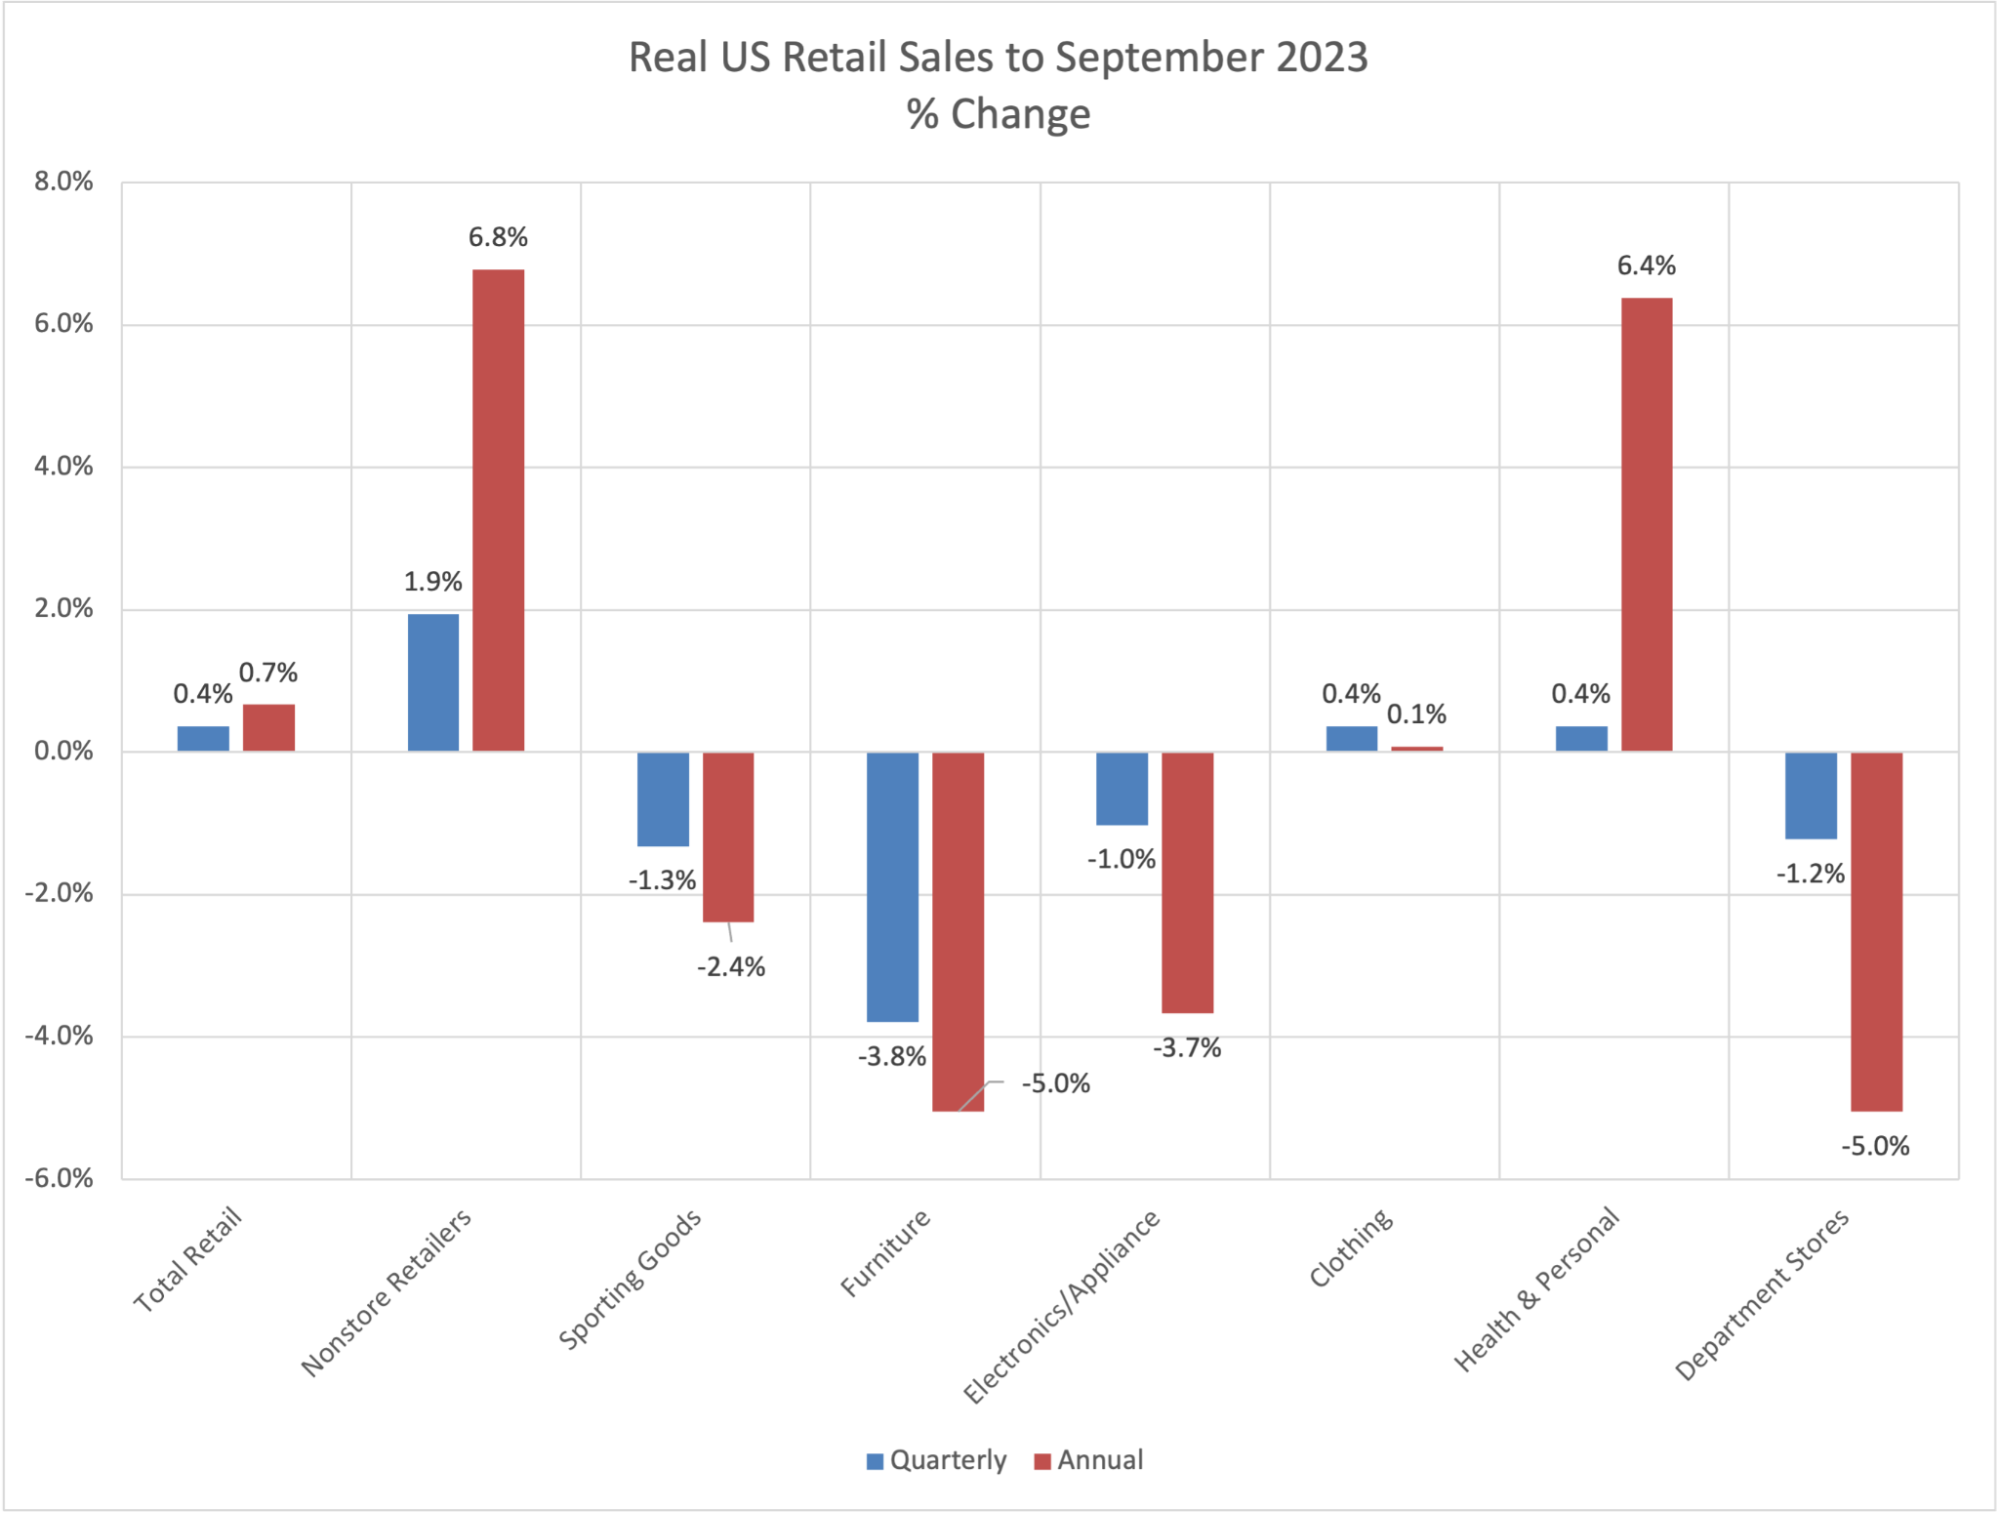
(Chart Source: US Census Bureau)
Retail sales data for September seemed to tell a story of continuing and unexpected strength in US consumption. Retail trade sales were up 0.7% from August and up 3.0% from September 2022.
As we have noted before, though, this data series is particularly challenging to interpret. The numbers do account for seasonal variation, but not for month-to-month volatility and not for inflation. The aggregate data can also conceal substantial differences in how particular retail categories are performing. We’ll address each of these.
For month-to-month noise, we consider three-month quarters. The most recent is July-September 2023. We compare this grouping of months both to the three months preceding (April-June, with seasonally-adjusted numbers) and to the three months a year earlier (July-September 2022). In the chart we describe the first comparison as “quarterly” and the second as “annual.” This should smooth month-to-month vacillation.
Right off the bat, one sees a less striking number for total retail sales – up 0.7% over the comparable period in 2022 (the annual number and red bar in the chart). While the 0.4% quarterly growth may look tame, the annualized growth rate would be 1.5%. Thus, retail sales appear to be accelerating.
These numbers are adjusted for inflation. To do that, we turn to the most relevant subcomponent of inflation measures – all commodity prices in the CPI less food and energy commodities. The distinction is important because inflation has settled down quite a bit for the sorts of commodities one would sell in stores. For the annual comparisons, this series shows prices increasing by 0.3%. For the quarterly comparison, prices dropped by 0.3%.
The higher inflation numbers one hears in CPI reports are heavily due to services inflation, and volatile sectors like energy (gasoline prices were up 6.6% for the quarterly comparison, for example).
As for the differences between different retail sectors, overall the strongest growth in the annual comparison was in Food Services & Drinking Places (up 8.1%), Nonstore Retailers (mostly online, up 6.8%), and Health & Personal Care (up 6.4%). For quarterly numbers, Gasoline Stations were a standout, up 5.6% at a quarterly rate, or an annualized 24.4%.
The weakest sectors by the annual measure were Furniture and Home Furnishing Stores (down 7.7%) and Building Materials & Garden (down 5.4%). This comes amidst a slowdown in housing sales (see new data below). While housing prices have remained relatively strong, the number of transactions has declined sharply. One important factor appears to be the reluctance of potential sellers to give up low fixed-rate mortgages. In theory, those reluctant sellers could pour money into redecorating, but if they are, the retail sales numbers show that it’s not enough to offset the purchases that normally come with sales.
One sector that appears to be picking up is Clothing & Clothing Accessories. It grew by only 0.1% with the annual comparison, but 0.4% for the quarter. That quarterly number equates to an annualized 1.5%, showing a notable upturn.
The other interesting trend is the shift from mall anchors to online shopping. That had certainly been a key feature of retail during the onset of the pandemic, but the last year seems to show the same trend, with Nonstore Retailers up 6.8% annually and accelerating with an 8.0% annualized quarterly rate, while department stores dropped 5.0% annually and fell at a 4.8% annualized rate over the quarter.
None of this contradicts the basic story of continuing steady US consumption and retail; it just shows that it matters where you look.
Economic Developments
The US Federal Reserve did not raise interest rates this week – the FOMC didn’t even meet – but rates rose significantly nonetheless. The yield on the US 10-year Treasury bond crossed 5.0% for the first time since 2007 and mortgage rates hit 8.0%. These longer-term rates have a more direct effect on the economy than the short-term Fed Funds rate and serve as the transmission mechanism for tightened monetary policy.
Industrial production in US manufacturing rose 0.4% from August to September but was down 0.8% for the year to September. Capacity utilization in manufacturing was 77.8%, down 0.4 percentage points from its long-term average.
According to the National Association of Realtors, existing home sales fell by 2.0% (seasonally adjusted) from August to September. For the year to September, sales were down 15.4%. This all happened while the median home sales price rose by 2.8%, suggesting that supply constraints were at least counterbalancing any dropoff in demand.
China’s GDP growth quickened in Q3, up 1.3% from Q2. That compares to 0.5% growth from Q1 to Q2. Year over year, Q3 was up 4.9% over 2022. In its latest World Economic Outlook update, issued earlier this month, the International Monetary Fund forecast that China would grow by 5.0% in 2023 and 4.2% in 2024.
In the first half of 2023, Japan’s imports dropped by 12.4%, heavily driven by lower energy costs. Exports were up 1.4% over the same period, helped by the auto sector. Japan’s exports to the United States grew by 10.6%.
Euro Area trade fell dramatically in the year to August. While extra-EA exports fell by 3.9%, imports from the rest of the world fell by 24.6%, and intra-EA trade contracted by 13.2%. The numbers were less dramatic on a year-to-date basis, with exports up 1.5%, imports down 10.6%, and intra-EA trade down 1.8%.
Euro Area inflation was 4.3% in September, down from 5.2% in August and 9.9% a year earlier. Excluding energy, the inflation rate was 5.5%. Services were the most important contributor to inflation, with prices rising at a 4.7% rate.
Policy Developments
In a speech this week, Fed Chairman Jay Powell noted progress on bringing down core inflation (currently at 3.7%, down from 5.6% in February 2022) but described this as only the beginning of what is required to get inflation down to the Fed’s 2.0% goal. He noted that “Financial conditions have tightened significantly in recent months, and longer-term bond yields have been an important driving factor in this tightening.”
A study by the New York Federal Reserve downplayed the likely impact on US consumption of the return of student loan repayments. The authors estimated that the resulting reduction in consumption would be a 0.1 percentage point reduction in aggregate spending from August levels.
After multiple votes, the US House of Representatives still needs an elected Speaker, following the departure of Kevin McCarthy (R-CA) from the chair at the beginning of the month. Until there is a Speaker, the House cannot pass bills. Current government funding runs through November 17, less than four weeks away.
Disclaimer: The contents of this report are made available for informational purposes only and should not be relied upon for any legal, business, or financial decisions. Flexport does not guarantee, represent, or warrant any of the contents of this report because they are based on our current beliefs, expectations, and assumptions, about which there can be no assurance due to various anticipated and unanticipated events that may occur. This report has been prepared to the best of our knowledge and research; however, the information presented herein may not reflect the most current regulatory or industry developments. Neither Flexport nor its advisors or affiliates shall be liable for any losses that arise in any way due to the reliance on the contents contained in this report.
About the Author


