July 28, 2022
Down, But Not Out - Commodity Price Inflation Drivers Revisited
Down, But Not Out - Commodity Price Inflation Drivers Revisited

Is inflation going to prove transitory? Global commodity prices were boosted in part by disruptions caused by the conflict in Ukraine and contributed to the surge in consumer prices. Most commodity prices are now well below their recent peaks either due to global supply chain realignments linked to the conflict or because of rising concerns about a recession. Many energy and food prices nonetheless remain well above the level of a year ago.

What's behind the recent surge in supply chain and consumer prices? Precisely segmenting the drivers of Consumer Price Inflation (CPI) is a challenge. The change in CPI can be broken into key components, as shown in Figure 1 for U.S. headline CPI based on U.S. government data. The rapid ascent in food and energy prices raises commodity prices as a major candidate.
In this report we revisit our earlier analysis on the commodity price drivers of inflation—released in September 2021 when many central banks still considered inflation to be “transitory”—to investigate whether those particular drivers have started to reverse.
Bulk Commodities Turning Over
The surge in commodity prices experienced since mid-2020 had at least two causes:
- Elevated demand for consumer goods, creating demand for materials in manufacturing supply chains; and
- The conflict in Ukraine, which has disrupted supply chains for a wide range of energy, metals, and agricultural commodities.

The strength of the U.S. dollar has mitigated the impact of lower commodity prices in non-dollar economies as many commodities are priced in dollar-terms in contracts. As shown in Figure 2 above, commodities in dollar terms (black line) have dropped by 19% from their March peak while in euros they fell by 12% (purple line).
Looking at data (see note 1) for the major commodity categories in turn:

Energy prices have surged since fall 2021 on the expectation of a conflict in Ukraine. The prospect of widespread sanctions against Russian oil exports raised concerns about oil availability. More recently, though, they have declined.
Crude oil prices are down by 15% since their June peak, shown by the black line in Figure 4. The prospects of a recession and a realignment of oil flows, with Russian oil heading to India and China, have offset earlier pressures, according to the IEA. A key unknown factor for oil flows is whether U.S. and EU plans to enforce a price cap on Russian fuel exports will be successful.
Natural gas prices (blue line in Figure 3) have been more volatile. While they are 13% below their peak they have ticked up in both June and July. That likely reflects concerns about short-term availability of gas in the EU to rebuild supplies as well as ongoing flows during the winter.
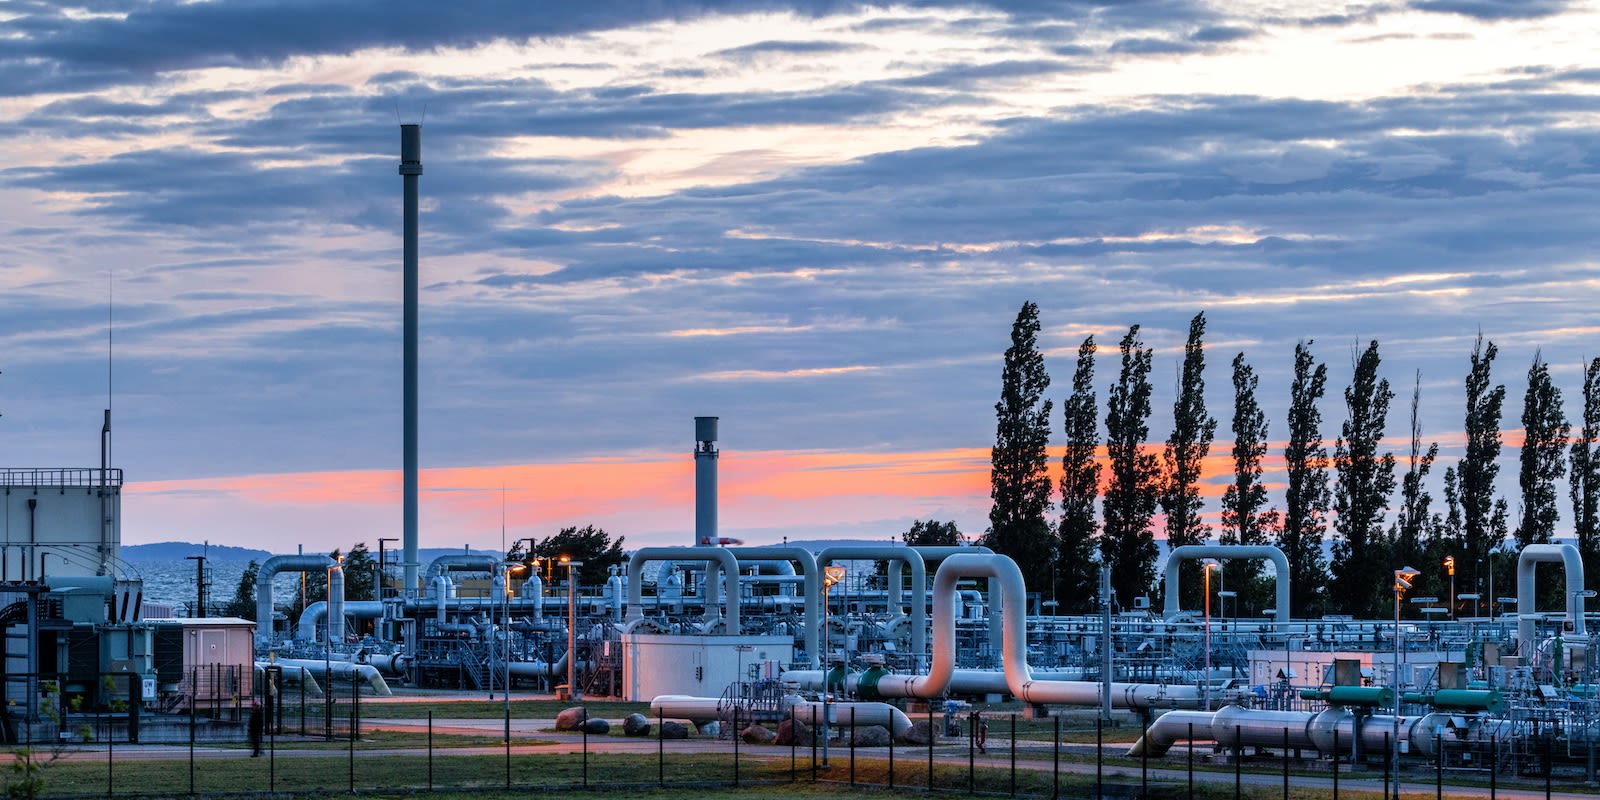
While the Nordstream 1 gas pipeline, a key route from Russia to Germany, is open, its flows are just 20% of nominal. The EU has launched plans to ration the use of natural gas to 85% of normal levels from August onwards. Final rules on the targets by industry for such rationing have yet to be confirmed.
The falling price of oil and natural gas will have a direct impact on fuel and heating costs as well as on derived products, including plastics, fertilizers, and other petrochemicals.
Coal prices have fallen by just 6% from their April peak. That may reflect coal’s use as a substitute for natural gas in some countries’ power generating mix as well as the forthcoming implementation of EU sanctions against Russian coal exports.

The initial conflict-driven upturn in base metals has reversed as supply chains realign and as recession concerns mount. Broadly speaking, they have fallen more significantly than energy. Within the group of products used to produce steel, prices for nickel and iron ore have fallen by 37% and 31% respectively since their recent peaks.
Aluminum has fallen by 32% and copper has fallen by 29%. While less exposed to the conflict, copper is widely used in economically sensitive products in the building industry as well as consumer electronics. Metals producers have raised concerns that the lower commodity prices have come at the same time that costs have increased, particularly electricity for aluminum and copper.

The rapid increase in agricultural prices in Q1’22 was largely a function of the conflict in Ukraine. That had a direct impact on exports from that country, notably sunflower oil and wheat, as shown in Figure 6. There was also an increase in prices for substitutes, such as palm oil, where export protectionism has been rife.
Yet, there has been a marked reduction in commodity prices in June and July. Wheat prices are now down by 26% from their March peak while sunflower oil is down by 37%. Both have fallen in the wake of a deal involving Russia, Ukraine, and Turkey to allow shipping to proceed, though it has yet to be fully implemented. Export protectionism in palm oil in Indonesia has now been removed, resulting in a 35% slide in prices from their peak.
Conflict has not been the only driver of food prices, with global weather conditions and, more recently, disease in Australia playing a part. Indeed, beef prices have risen by 8% in July and have therefore risen by more than cereals or oils when compared to January 2021 levels.
Finally, it should be noted that while commodities are down from their peaks, most energy and food are still 10% to 200% above the level of a year ago.
In conclusion: Most commodity prices are now well below their recent peaks either due to global supply chain realignments linked to conflict or because of rising concerns about a recession. It remains to be seen whether this will be enough to bring down inflation.
Note (1) Baseline data uses World Bank monthly records through June 2022. Data for July 2022 based on the latest readings for trading websites including Bloomberg (crude oil, zinc, aluminum, wheat and beef), Business Insider (coal), the Financial Times (iron ore), the Intercontinental Exchange (natural gas), the London Metals Exchange (nickel) and Trading Economics (palm oil and sunflower oil).
Disclaimer: The contents of this report are made available for informational purposes only and should not be relied upon for any legal, business, or financial decisions. Flexport does not guarantee, represent, or warrant any of the contents of this report because they are based on our current beliefs, expectations, and assumptions, about which there can be no assurance due to various anticipated and unanticipated events that may occur. This report has been prepared to the best of our knowledge and research; however, the information presented herein may not reflect the most current regulatory or industry developments. Neither Flexport nor its advisors or affiliates shall be liable for any losses that arise in any way due to the reliance on the contents contained in this report.
About the Author


