

Global Logistics Update
U.S. Reaches Trade Deals with Japan and Philippines; TAWB Sees Severe Congestion
Updates from the global supply chain and logistics world | July 24, 2025
Global Logistics Update: July 24, 2025


July 24, 2025
Trends to Watch
Talking Tariffs
- U.S. and Japan Reach Trade Deal: On July 22, President Trump announced on Truth Social that the U.S. and Japan have reached a trade agreement.
- Under the proposed trade deal, Japan will face a 15% reciprocal tariff; invest $550 billion into the United States, which will receive 90% of the profits; and “open their country to trade, including cars and trucks, rice, and certain other agricultural products.”
- The proposed 15% reciprocal duty on Japanese imports walks back the previously proposed 25% tariff on Japan that President Trump had announced on Truth Social on July 7.
- The trade deal will also reduce auto tariffs on Japan from 25% to 15%. Last year, more than a third of Japanese goods imported into the U.S. consisted of automobiles and auto parts.
- The deal is expected to take effect on August 1, alongside reciprocal duties announced for more than two dozen other U.S. trade partners. All await official confirmation via executive order or Federal Register notice.
- U.S. and Philippines Reach Trade Deal: On July 22, President Trump announced that the U.S. and the Philippines have also reached a trade agreement. Under the proposed deal, the Philippines will face a 19% reciprocal tariff—a small reduction from the 20% duty President Trump had previously announced. Exactly when and how the trade agreement will be implemented is currently unclear.
- U.S. Lays Out Terms of Trade Deal with Indonesia: On July 22, the U.S. and Indonesia released a joint statement detailing the terms of the trade agreement announced last week.
- Indonesian goods imported into the U.S. will face a 19% reciprocal tariff, while U.S. goods imported into Indonesia will not be subject to any tariffs.
- Indonesia will address certain non-tariff barriers by eliminating taxes on digital services (like internet data and streaming), pre-shipment inspections of American agricultural goods, export controls on critical minerals, and more. Indonesia will also accept U.S. federal motor vehicle safety and emissions standards for autos exported from the U.S.
- It is currently unclear when these terms will take effect. According to the joint statement, the two nations will “negotiate and finalize the agreement … in the coming weeks.”
- Other Tariff Developments:
- Yesterday, U.S. Treasury Secretary Scott Bessent stated that the existing 30% effective duty rate on China is likely to extend beyond August 12. In the meantime, negotiations will likely involve China’s ongoing imports of “sanctioned” Russian and Iranian oil.
- U.S.-India trade talks are in progress. In particular, India seeks to reduce the 26% reciprocal duty announced on Liberation Day, the 50% duty on steel and aluminum, and auto tariffs.
- A 50% tariff on copper imports, which President Trump announced earlier this month, is set to take effect on August 1.
- Over the past few weeks, President Trump has announced his proposed reciprocal tariff rates for more than two dozen trade partners. For a full list of these rates, check out our live blog.
- Other potential duties President Trump has recently suggested include a 10% tariff on BRICS countries and a 200% tariff on pharmaceuticals.
Ocean
TRANS-PACIFIC EASTBOUND (TPEB)
- Capacity and Demand:
- Market demand in August is expected to remain similar to July levels.
- Overall carrier capacity deployment for July is 80%-90%, with a slight decrease to 75%-86% in August. Despite some service suspensions to the Pacific Southwest (PSW) and ad hoc blank sailings, the market is experiencing ongoing overcapacity compared to demand. Overall, space is open.
- Services originating in Southeast Asian ports are experiencing some delays due to continued congestion in Malaysia and Singapore. Expect three to five days of additional transit time, versus proforma.
- Equipment: Equipment shortages and weather disruptions, including typhoons in South China and Southeast Asia, are further challenging schedule reliability at origin.
- Freight Rates:
- The East Coast Peak Season Surcharge (PSS) will be removed for August.
- For the West Coast, there continues to be no PSSs for any gateway into August.
- Several carriers have announced an August 1 General Rate Increase (GRI). These rates are expected to be finalized closer to August, as demand solidifies.
FAR EAST WESTBOUND (FEWB)
- Capacity and Demand:
- Six blank sailings have been announced for August, all from the Ocean Alliance.
- Average weekly capacity in August has reached 324,000 TEUs, increasing 1.4% month over month.
- Due to EU port congestion in July delaying vessel returns and disrupting schedules, both Maersk and MSC are deploying smaller vessels on several services in August to maintain weekly departures, and to avoid skipping sailings.
- European economic recovery is supporting strong demand, which is expected to continue in August.
- Equipment shortages and weather disruptions, including typhoons in South China and Southeast Asia, are further challenging schedule reliability at origin.
- Freight Rates:
- The Shanghai Containerized Freight Index (SCFI) has been stable at $2,030–$2,100/TEU over the past four weeks.
- Rates may stay at elevated levels or even increase, in light of supply constraints and strong demand expected to continue in August. Rate increases are also being driven by tight space and equipment at origin, along with congestion and customs delays at key European ports.
- To test the market, some carriers have already increased August offers by 10%.
TRANS-ATLANTIC WESTBOUND (TAWB)
- Capacity and Demand:
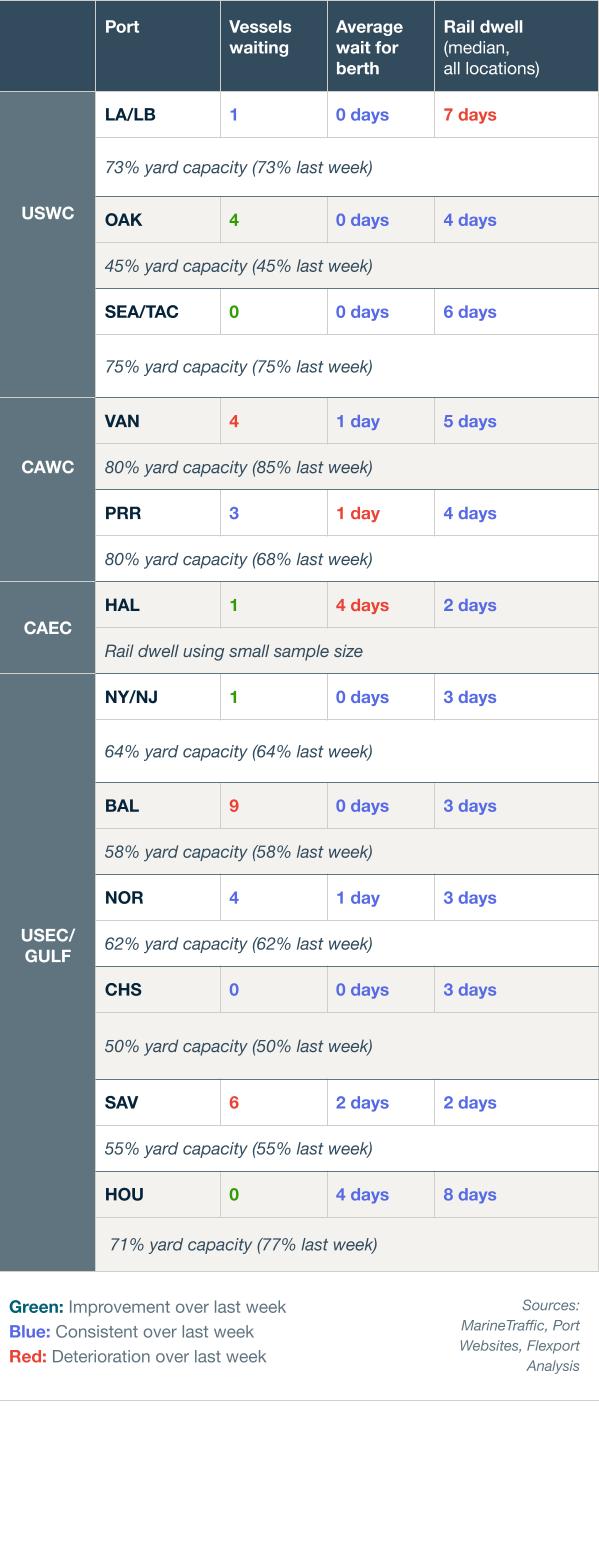
- Antwerp is experiencing its worst congestion since Covid-19, with dwell times exceeding eight days and yard usage above 90%.
- Rotterdam, Hamburg, and Bremerhaven are seeing 80-85% yard utilization, resulting in vessel delays of two to four days.
- Piraeus, Genoa, and Valencia report ongoing yard overcrowding and vessel wait times of two to five days, consistent with prior trends.
- Export demand from Europe remains consistent.
- The proposed 30% tariff on Europe, set for August 1, is contributing to ongoing uncertainty for businesses engaged in trade with the U.S.
- Demand is decreasing due to summer holidays.
- The blank sailing rate is currently around 4–7%, dropping month over month. Capacity is stable.
- Equipment: Austria, Slovakia, Hungary, and Southern/Eastern Germany continue to face container and chassis shortages. Portugal is also experiencing container imbalance issues.
- Freight Rates: In Northern Europe, West Mediterranean, and East Mediterranean, all carriers have postponed implementing PSSs announced for July. Rates are expected to remain stable until the end of Q3.
INDIAN SUBCONTINENT TO NORTH AMERICA
- Capacity and Demand:
- Capacity to the U.S. East Coast has increased, with July kicking off the Indian subcontinent’s traditional peak season. One carrier is adding vessels back to their Northeast India to U.S. East Coast service, but temporarily omitting Charleston for enhanced service reliability.
- Capacity to the U.S. West Coast is available again, given the sharp increase of capacity in the TPEB market and services that enable Indian subcontinent shippers to deliver cargo to the U.S. West Coast.
- Freight Rates:
- For cargo moving to the U.S. East Coast: GRIs and PSSs have been announced for the second half of July, but in general, those increases have not been implemented. Based on what carriers are seeing, there appears to be a large spread in the market across booking intakes and utilization. There may be a lack of typical peak season demand to support the rate increases, especially in light of capacity reinjected into the Indian subcontinent to U.S. East Coast trade.
- For Indian subcontinent cargo moving to the U.S. West Coast: GRIs did not stick in the market and PSSs have come down, in line with TPEB lanes.
- Exports from Pakistan continue to see elevated cost and transit times due to additional feeder services needed to service the country in light of the India-Pakistan conflict.
Air
WEEK 28: JULY 7 - JULY 13, 2025
- Asia-U.S. Demand Drops Again: Tonnages fell -5% WoW after a -2% dip last week, led by Southeast Asia (including Indonesia -23%, Thailand -21%, Vietnam -14%), as U.S. demand remains soft post-holiday.
- Rates Hold Firm on North America Rebound: Despite lower global volumes, spot rates rose +1% WoW to $2.65/kg, driven by a +6% bounce in U.S.-origin tonnages and pricing after the July 4 dip.
- Middle East and South Asia (MESA) Hit by Conflict and Customs Issues: Tonnages were down -3% WoW, and spot rates were down -4%. Bangladesh volumes fell -4% overall, but rose +4% to the U.S. ahead of expected August 1 tariffs. India and Sri Lanka also declined.
- Asia-Europe Stable amid U.S. Softness: Asia-Europe tonnages held at +1% WoW, lifted by South Korea (+7%) and Malaysia (+5%). Meanwhile, Japan-U.S. rates dropped -20%, weighing on Asia-U.S. yields.
(Source: WorldACD)
Please reach out to your account representative for details on any impacts to your shipments.
North America Vessel Dwell Times
Upcoming Webinars
Navigating Peak Season: Essential Omnichannel & Fulfillment Strategies for Success
Thursday, July 31 @ 9:00 am PT / 12:00 pm ET
North America Freight Market Update Live
Thursday, August 14 @ 9:00 am PT / 12:00 pm ET
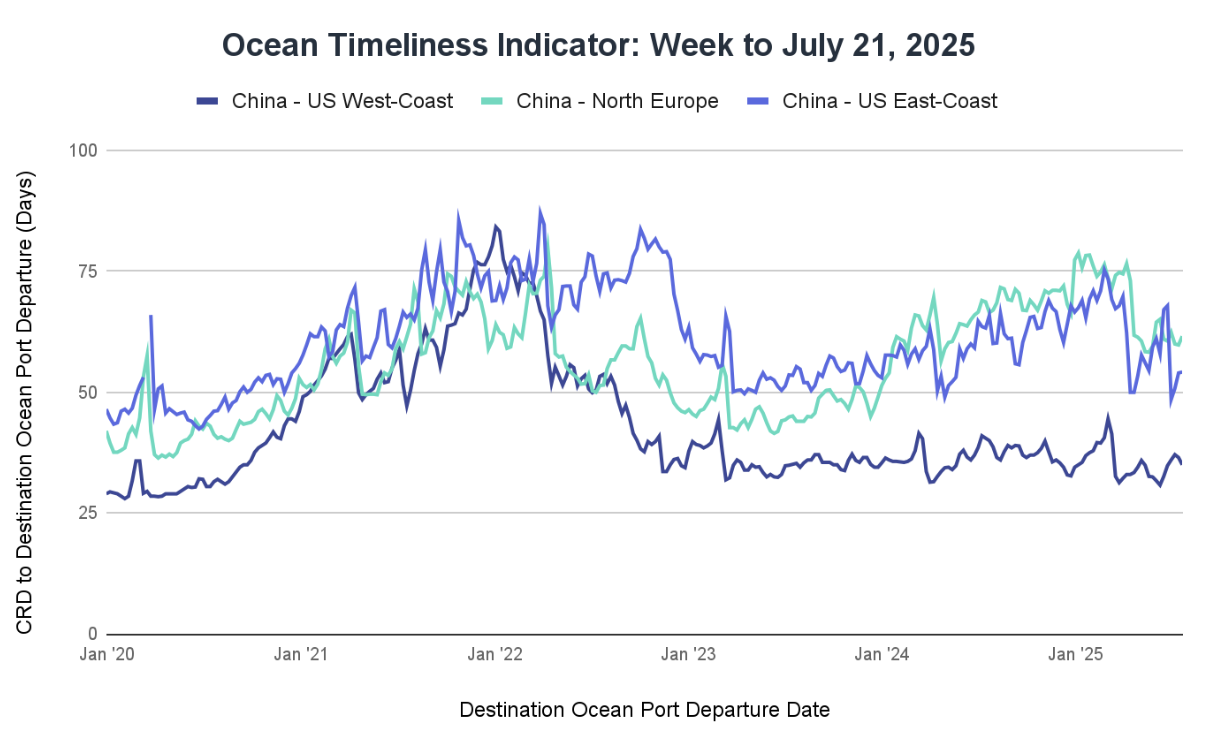
Ocean Timeliness Indicator
Transit time from China to the U.S. West Coast has slightly shortened, while the route from China to North Europe experienced a notable increase in duration. China to the U.S. East Coast also saw a minor rise in transit time.
Week to July 21, 2025
Transit time from China to the U.S. West Coast decreased by 1.5 days, falling from 36.5 to 35 days. The China to North Europe route saw a 1.8-day increase, moving from 59.8 to 61.6 days. Lastly, the transit time from China to the U.S. East Coast increased by 0.2 days, rising from 54 to 54.2 days.
See the full report and read about our methodology here.
About the Author
July 24, 2025


Sign up for Global Logistics Update
Why search for updates when we can send them to you?
Related content
![White House GettyImages-603224136 (1)]()
Blog
Live Updates: Trump Administration Tariffs, Trade Policy Changes, and Impacts on Global Supply Chains
![GettyImages-1411182583 1199x800]()
Blog
CBP’s Latest Guidance on Reporting Country of Smelt and Cast for Section 232 Aluminum Tariffs


More from Flexport
![GettyImages-136886416]()
Global Logistics Update
U.S. Launches New Section 301 Investigations; Middle East Escalation Drives Ongoing Ocean and Air Disruptions
![Ocean Port GettyImages-89849286]()
Global Logistics Update
CIT Orders IEEPA Tariff Refunds; Middle East Escalation Disrupts Air and Ocean Operations
![GettyImages-1295614211]()
Global Logistics Update
Prepare for Potential IEEPA Tariff Refunds; U.S. Blizzards Disrupt Europe and North America Air Freight Operations


Ready to get started?
Learn how Flexport’s supply chain solutions can help you capture greater opportunities.