

October 10, 2022
Taking Stock of the Supply Chain Crisis - The State of Trade
Is the state of logistics networks improving? When will we get back to normal?
Flexport’s State of Trade Webinar on September 28th, 2022 found evidence for an improvement in the state of logistics networks, though it is stronger in pricing than in the timeliness of shipping. Looking ahead, there are considerable unknowns including persistently high consumer spending and the evolution of corporate inventory strategies.
Rates Reverse - Evidence of Network Easing
The past three years have seen unprecedented disruptions to logistics networks in terms of their global nature, the scale of impact and the consecutive waves of challenges.
There’s evidence emerging that the worst disruptions are passing. During a poll held during the webinar, 78% of respondents indicated that the “pandemic supply chain crisis is still going on, but it’s winding down.”
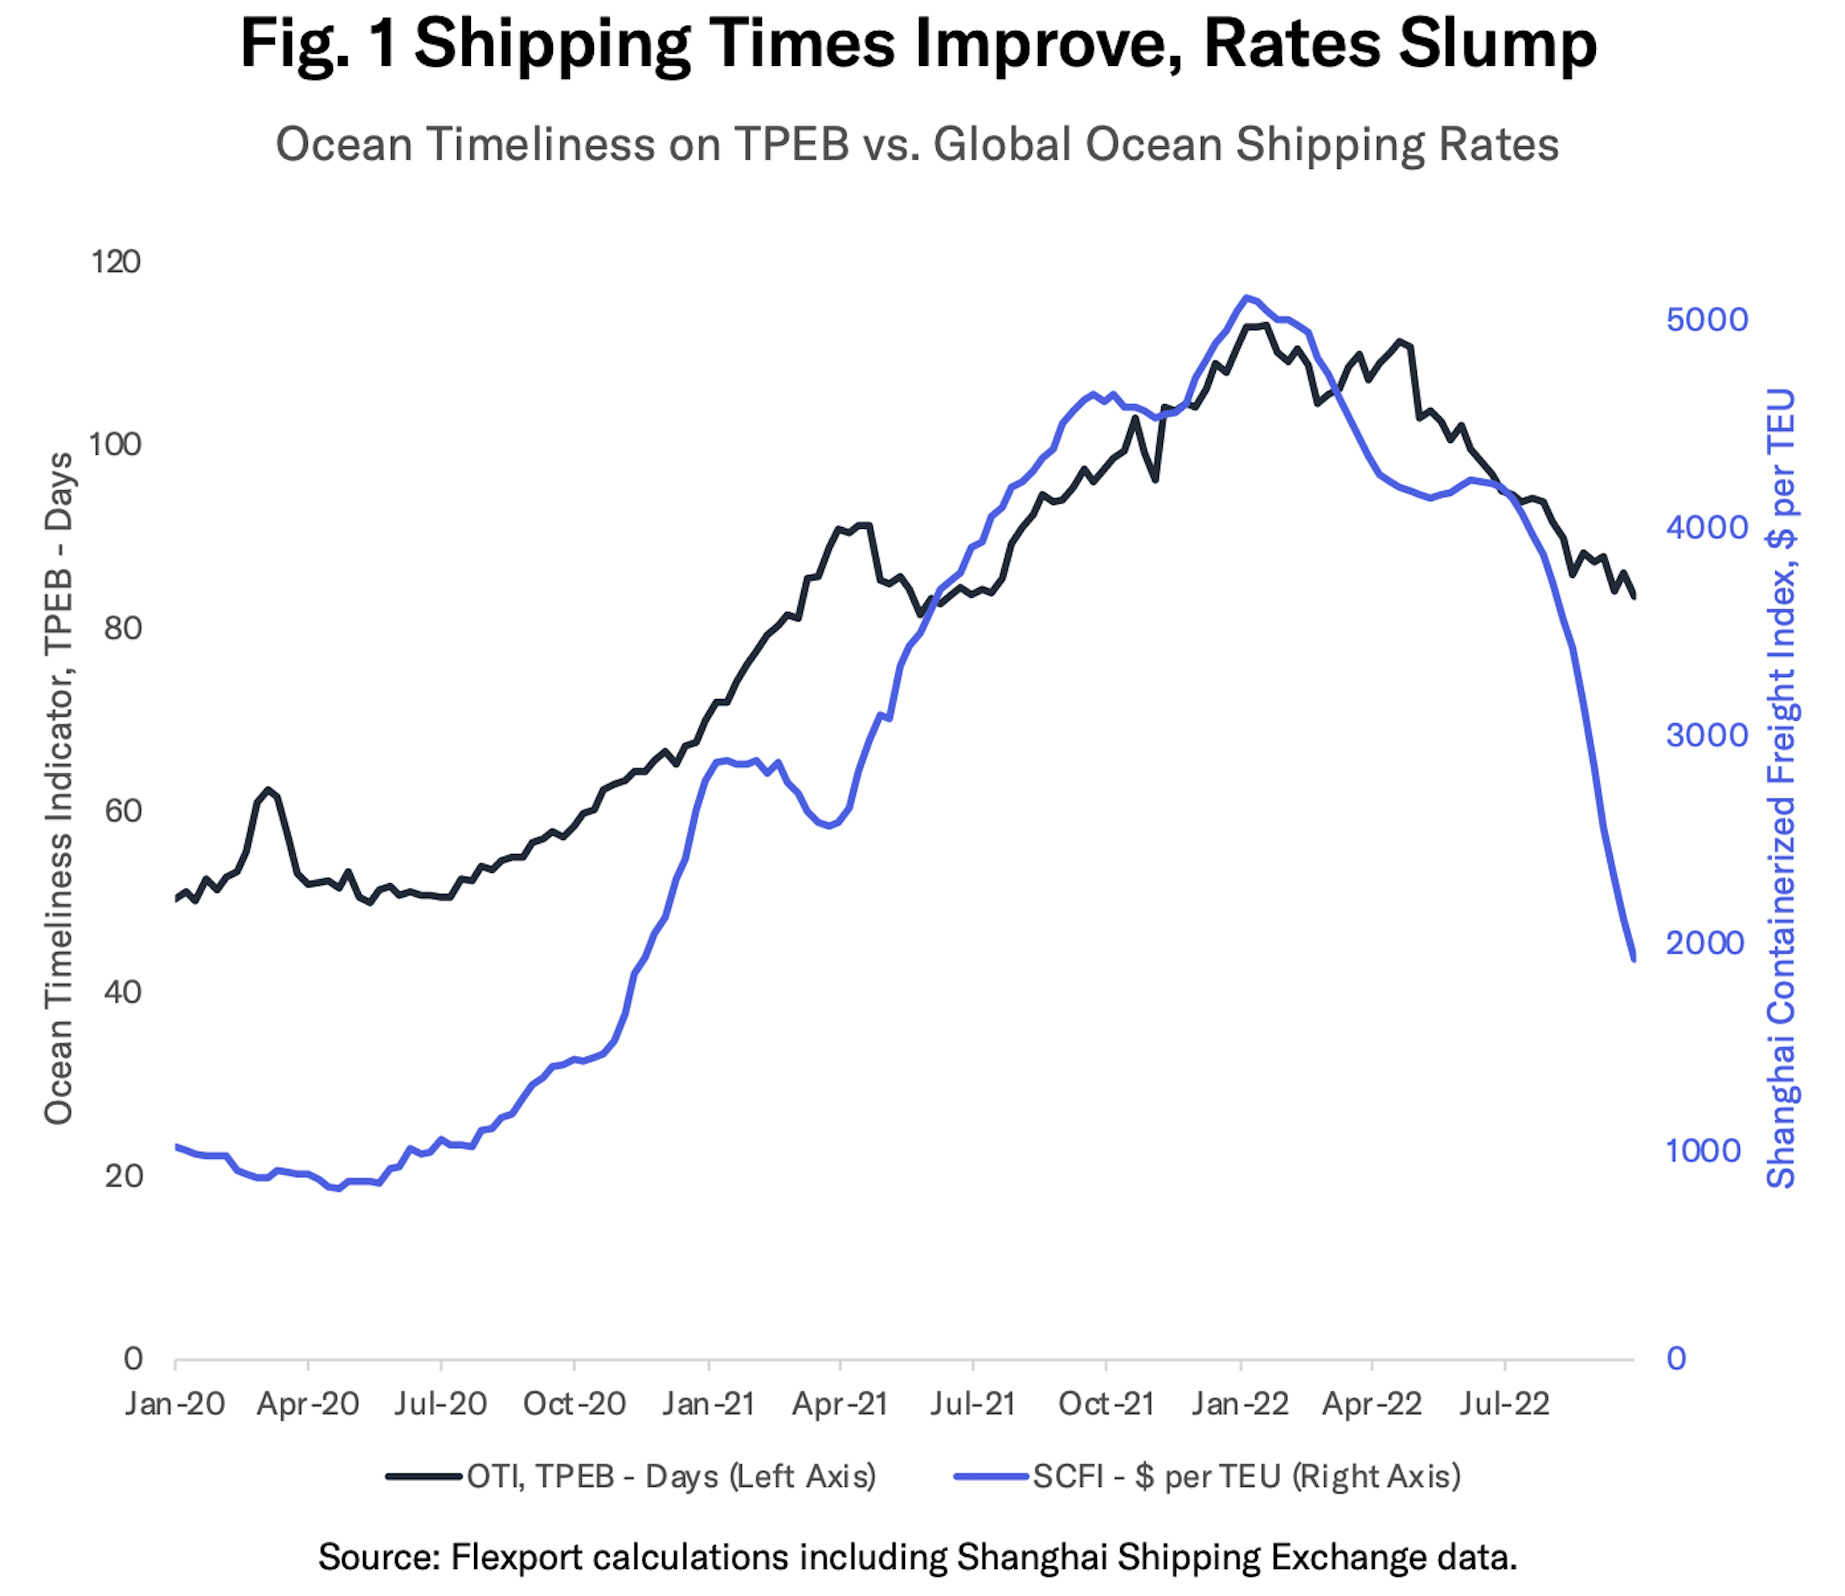
Figure 1 compares the timeliness and cost of shipping by ocean. The black line shows the time taken for ocean shipping on Transpacific Eastbound routes (TPEB, or Asia to North America) from the date cargo is ready to when it leaves the destination port.
The journey time peaked at 113 days in January 2022, compared to around 51 days in January 2020. The increase came in a series of waves, partly corresponding to seasonal increases, and was also seen in Far East Westbound (FEWB, or Asia to Europe) lanes.
Timeliness has since improved to 83 days as of the start of October 2022, but that still suggests that there are still considerable obstacles to be overcome. More details are available in Flexport’s Ocean Timeliness Indicator.
The blue line shows market prices for shipping out of Shanghai to a collection of global ports. Rates peaked at $5,110 per TEU (Shanghai Containerized Freight Index) in January 2022, compared to $1,000 per TEU in January 2020. They’ve since dropped on a weekly basis in 35 of the past 38 weeks to $1,923 per TEU at the start of October 2022. Rates for specific Transpacific routes have fallen even further.
Global shipping rates have therefore fallen by 62% from their peak, but remain 92% above the pre-pandemic level. Ocean timings meanwhile have fallen by 26% from its peak and remain 63% above the January 2020 level.
Not There Yet - Demand Remains High, Inventories Uncertain
So when will we get back to “normal”?
We’re already at the point where other concerns loom larger. Looking ahead, 49% of respondents to a poll during the webinar stated they’re “more worried about demand, recession, interest rates and other issues” while one quarter are facing pressure “to reduce shipping costs.”
We’re certainly not out of the woods as major uncertainties remain including the outlook for demand and the state of corporate inventories.
As discussed in prior research, the main driving force for the rise in logistics congestion has been a large, sustained and volatile increase in demand for durable goods.
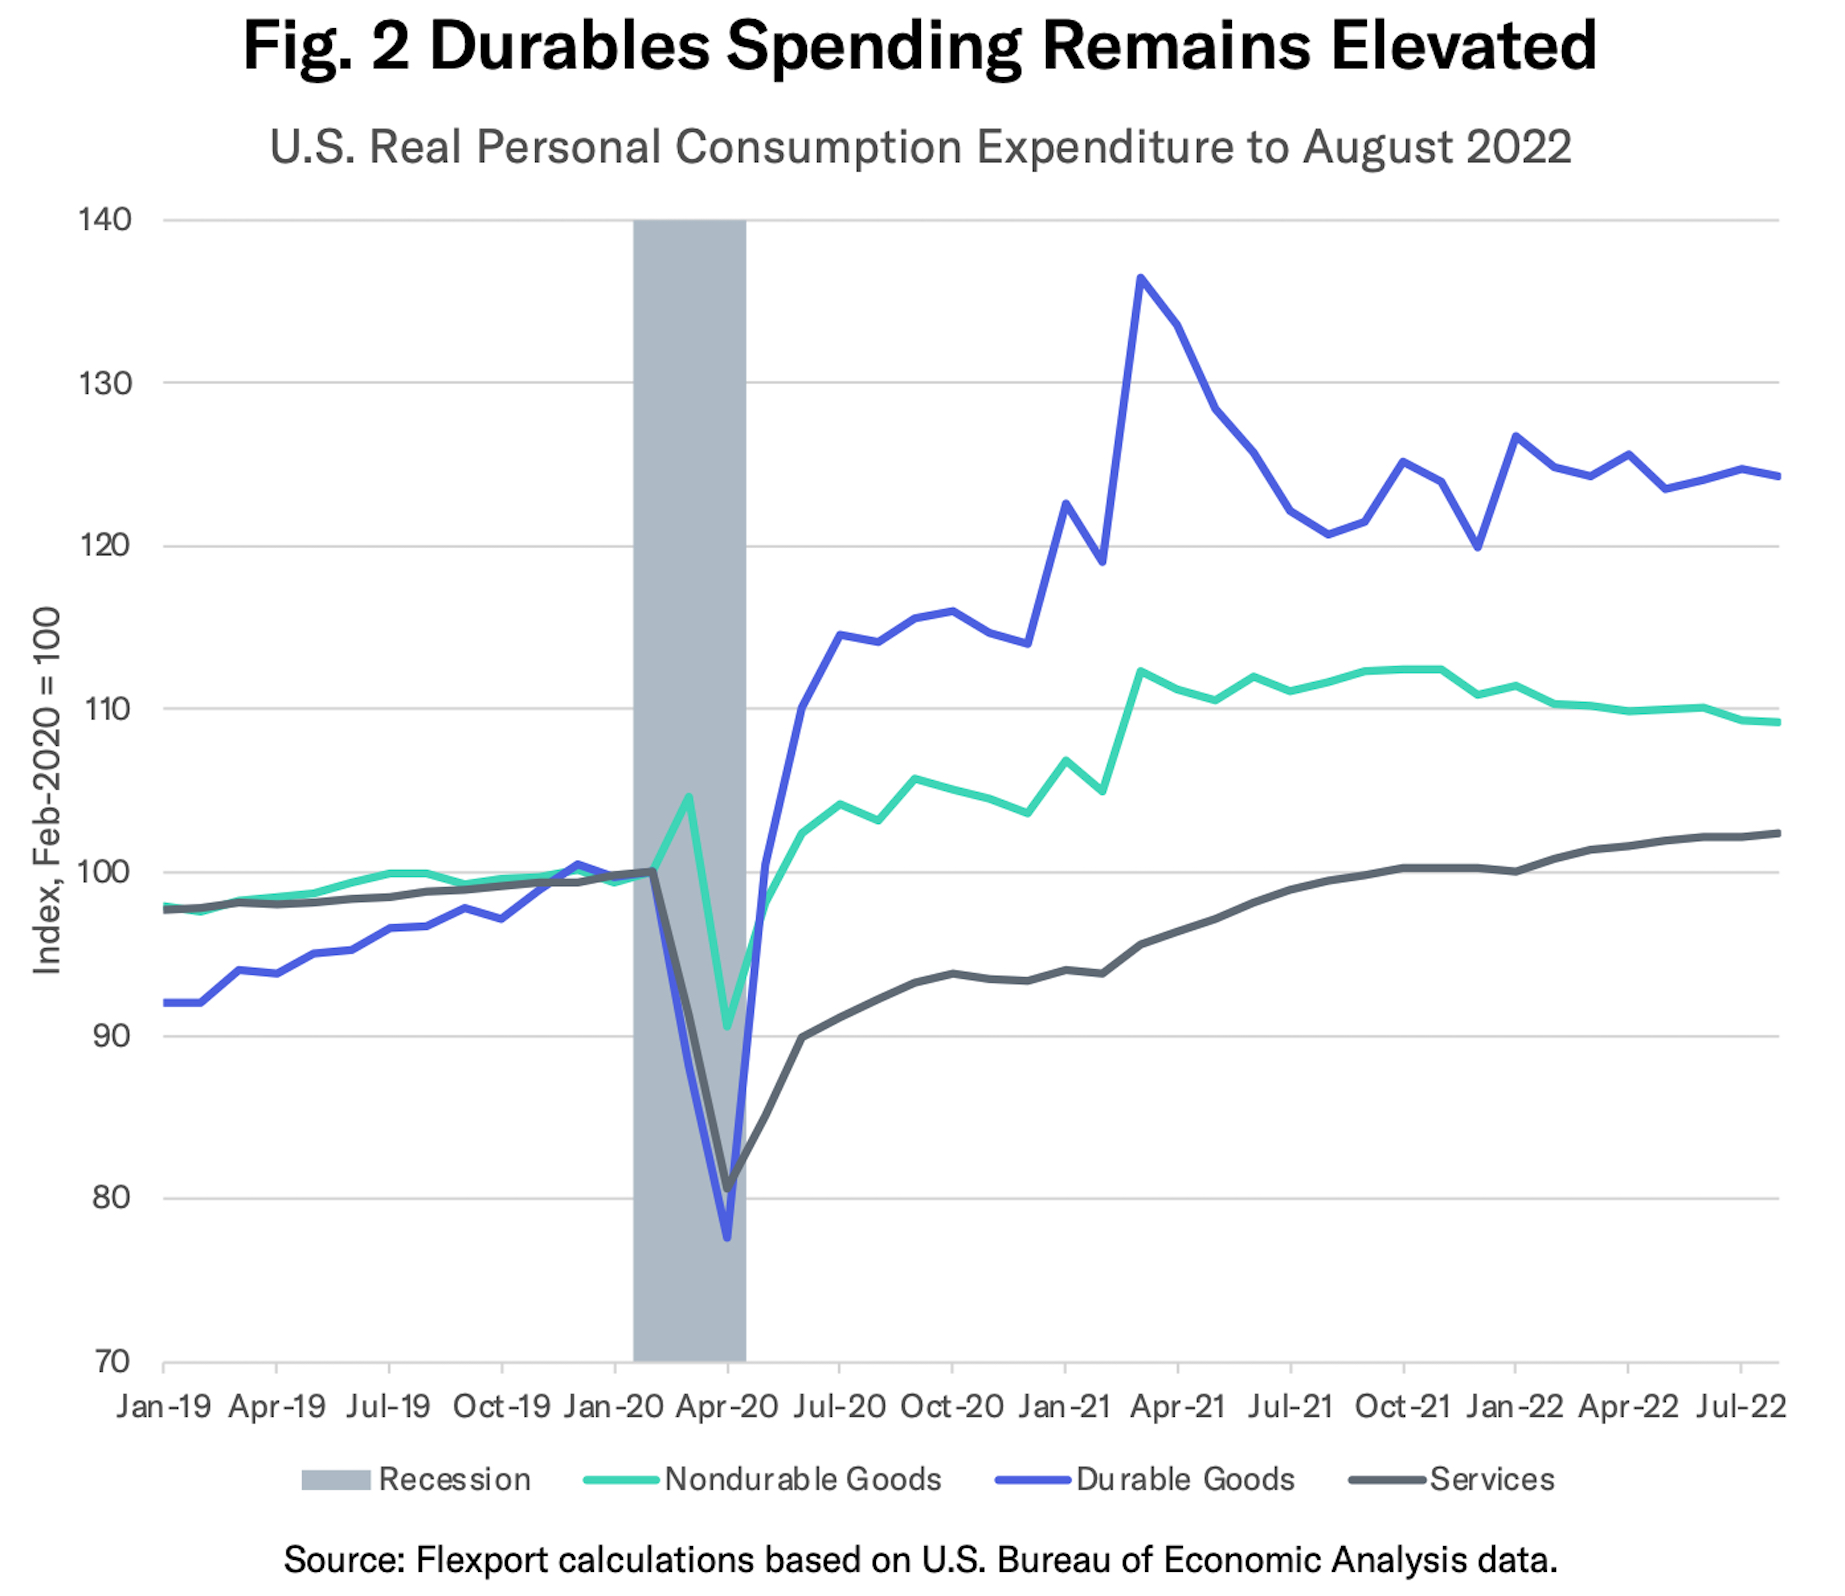
The blue line in Figure 2 shows that U.S. consumer spending on durable goods—products designed to last for at least three years, such as furniture, consumer electronics and cars—increased by 37% in March 2021 versus the February 2020 level. While it has subsequently declined, spending in August 2022 was still 24% above the February 2020 level. Spending on nondurable goods (green line) has also declined from its peak and remains 10% above February 2020.
While the U.S. Federal Reserve’s rate raising process may take some demand fuel off the fire, John Williams of the New York Federal Reserve recently noted that “The demand for durable goods remains very high—beyond what can be produced and brought to market, even with improved supply chains.”
That elevated level of goods-in-transit hasn’t just strained ocean shipping networks. There are also pain points being felt in rail network congestion, trucking capacity constraints and warehouse space shortages.
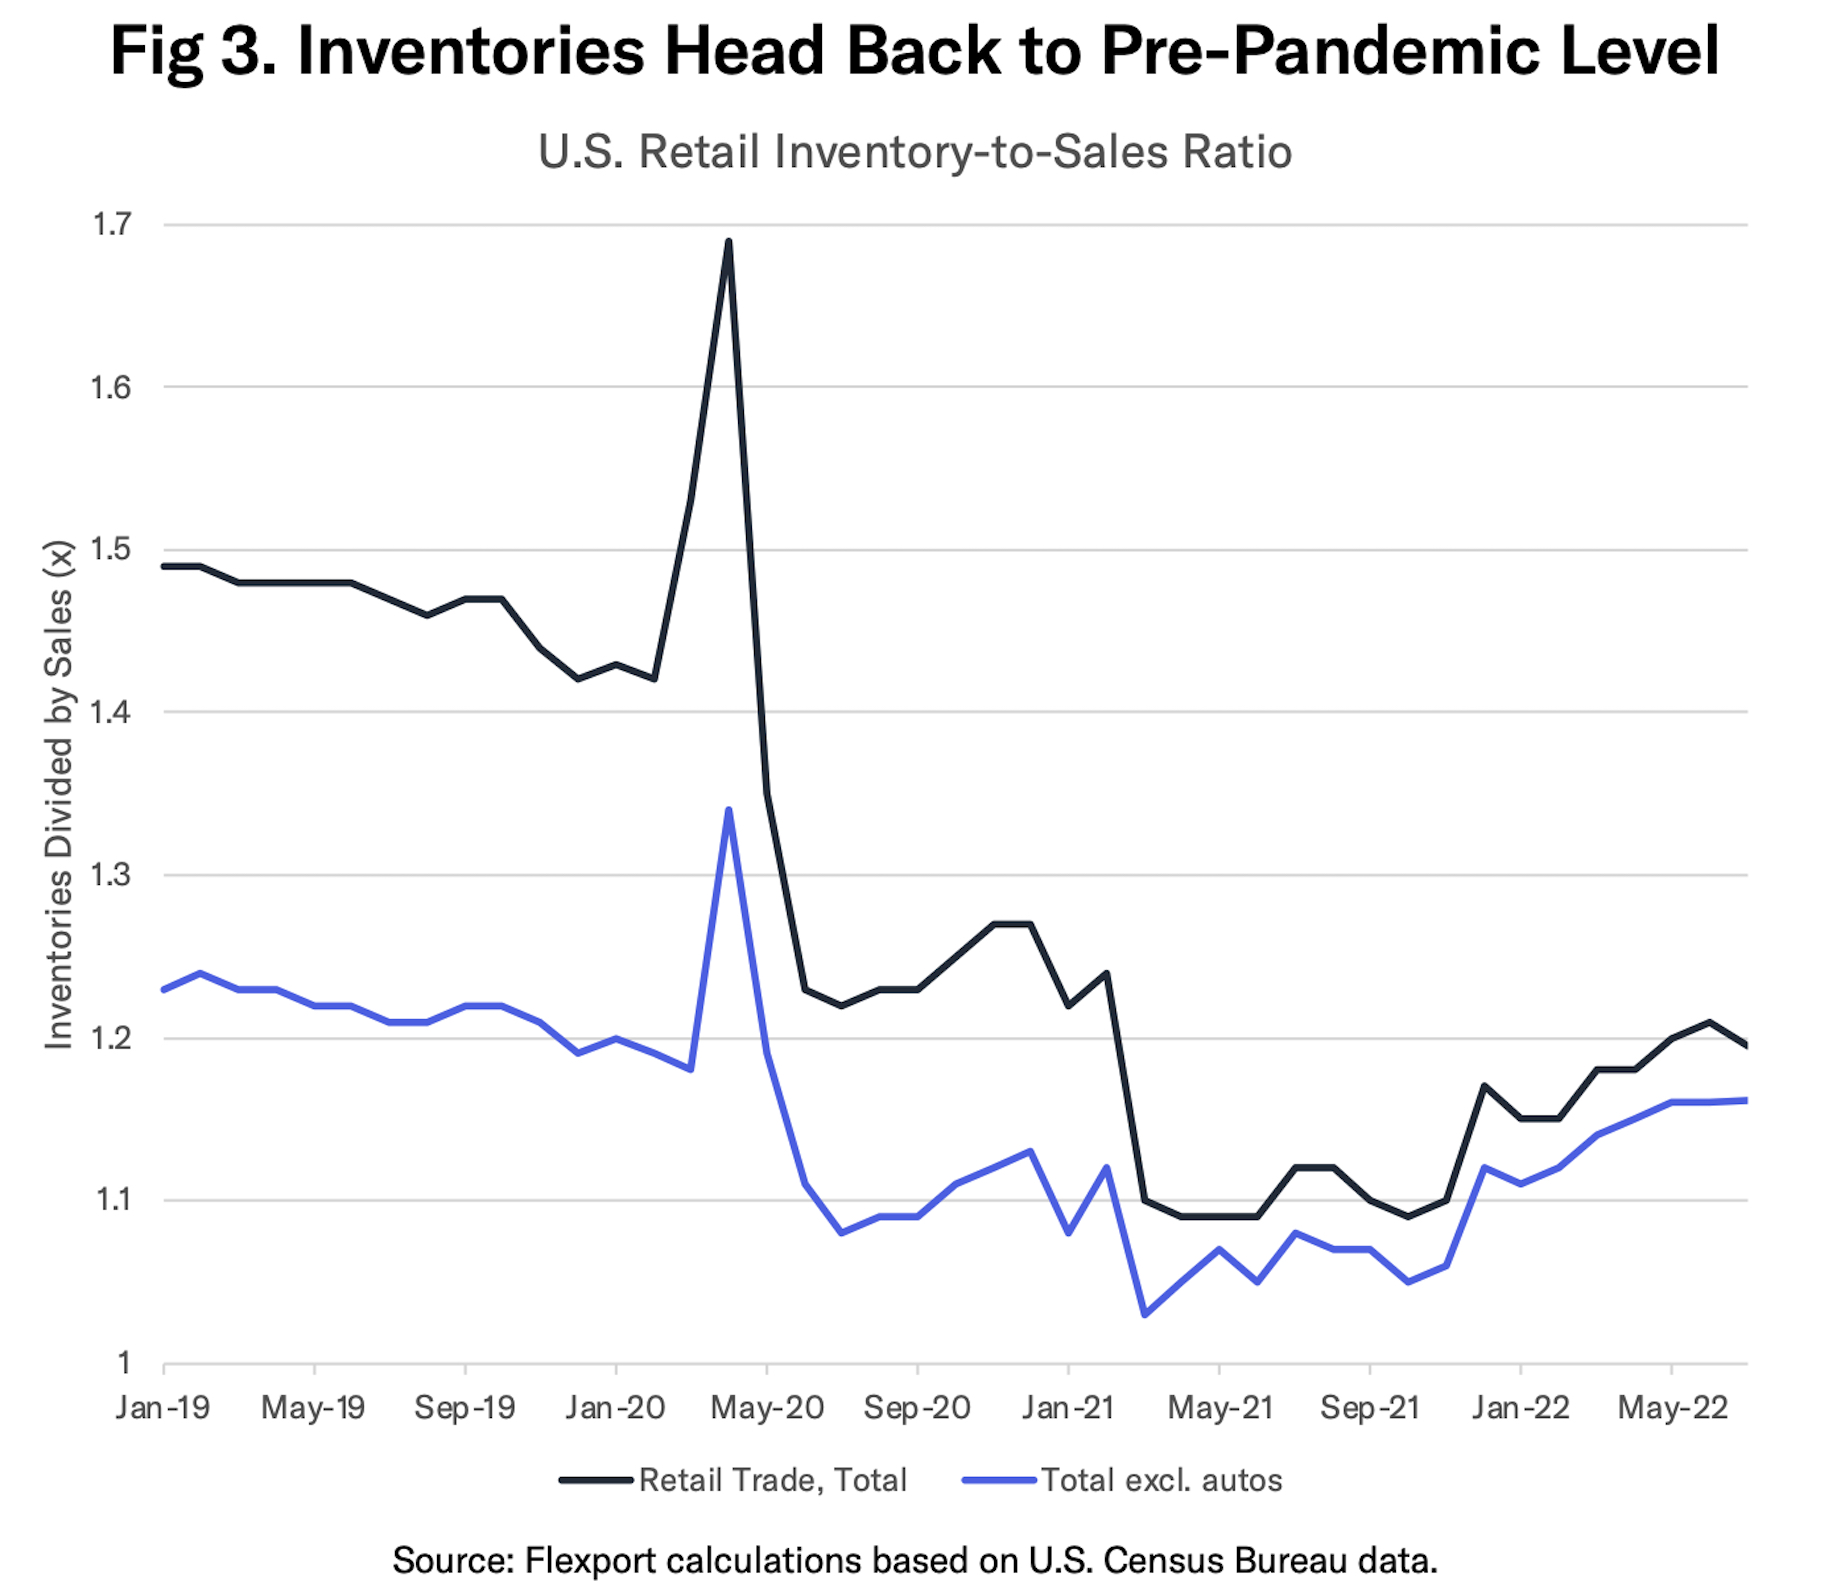
The latter is a direct expression of corporate inventory decision-making. Figure 3 above shows the inventory-to-sales ratio for U.S. retailers. Excluding autos, where supply chains have been disrupted by parts availability, the ratio dropped to a trough of 1.05x in October 2021 from an average of 1.22x in 2019. There’s since been a recovery to 1.16x in July 2022, after inventory growth of 18.2% outstripped sales growth of 7.2%.
The expansion in inventories has been even more rapid in consumer-focused sectors. As outlined in prior research, the inventory-to-sales ratio for corporations in household durables, leisure products and capital goods already outstripped their historic averages as of Q2’22.
It’s not clear, however, where the level of inventories—and associated need for further logistics activity—will settle.
Corporations so far have focused on short-term strategies. Flexport’s review of reasons stated by firms for higher inventories are led by: poor demand forecasting, avoiding repeats of prior years’ shortages, and aims to mitigate the impact of inflation. Most plan to cut their inventories from current levels in the remainder of 2022.
Looking further out, a return to “old normal” levels associated with just-in-time supply chains could see inventories rise by a further 5%. A change in inventory model to a more just-in-case focused approach could see inventories rise even higher. That could also include the continued shift to ecommerce retail models that require higher stock levels to satisfy immediate demands.
In conclusion: There’s clear evidence of an improvement in the state of logistics networks, though it is stronger in pricing than in the timeliness of shipping. Looking ahead, there are considerable unknowns including persistently high consumer spending and evolving corporate inventory strategies.
Disclaimer: The contents of this report are made available for informational purposes only and should not be relied upon for any legal, business, or financial decisions. Flexport does not guarantee, represent, or warrant any of the contents of this report because they are based on our current beliefs, expectations, and assumptions, about which there can be no assurance due to various anticipated and unanticipated events that may occur. This report has been prepared to the best of our knowledge and research; however, the information presented herein may not reflect the most current regulatory or industry developments. Neither Flexport nor its advisors or affiliates shall be liable for any losses that arise in any way due to the reliance on the contents contained in this report.
Related content
![2022-09 Inventory Fashion Masthead]()
Economic Insights
More Discounts, More Shipping - Apparel Inventory Strategies
September 19th, 2022
![2022-09 Inventory Toys Masthead]()
Economic Insights
Santa Claus is Coming to Town Early - Toy Inventory Strategies
September 14th, 2022


