

August 22, 2022
Europe’s Power Problem - Flexport Weekly Economic Report

Europe’s Power Problem - Flexport Weekly Economic Report

European gas and electricity prices for delivery during the coming winter have risen by 40% since the start of July. The market is pricing in supply interruption risks. Should supplies fail, the consequences will be felt in higher producer price inflation. There’s also the potential for reduced industrial production, ranging from food and plastics to cars and machinery.
In Focus - Winter is Coming, Should we be Worried?
Natural gas and power prices have soared, but should supply chain planners be concerned? The Ukraine conflict has cast doubt over supplies of natural gas in Europe. On the one hand, natural gas reserves are currently in line with historic averages and stand at 77% of capacity. That would suggest there is little to be worried about right now. On the other hand, storage levels now are no guarantee of security for the coming winter. The latest closure of a key pipeline is a reminder of the fragility of Europe’s natural gas supplies.
Power generation in Europe also faces threats. There’s reduced availability of natural gas. Coal supplies are trapped on the Rhine river. Low and warm river conditions may restrict the operation of hydroelectric and nuclear power plants. There are therefore plenty of reasons to be worried.
So what is the future for energy availability and prices?
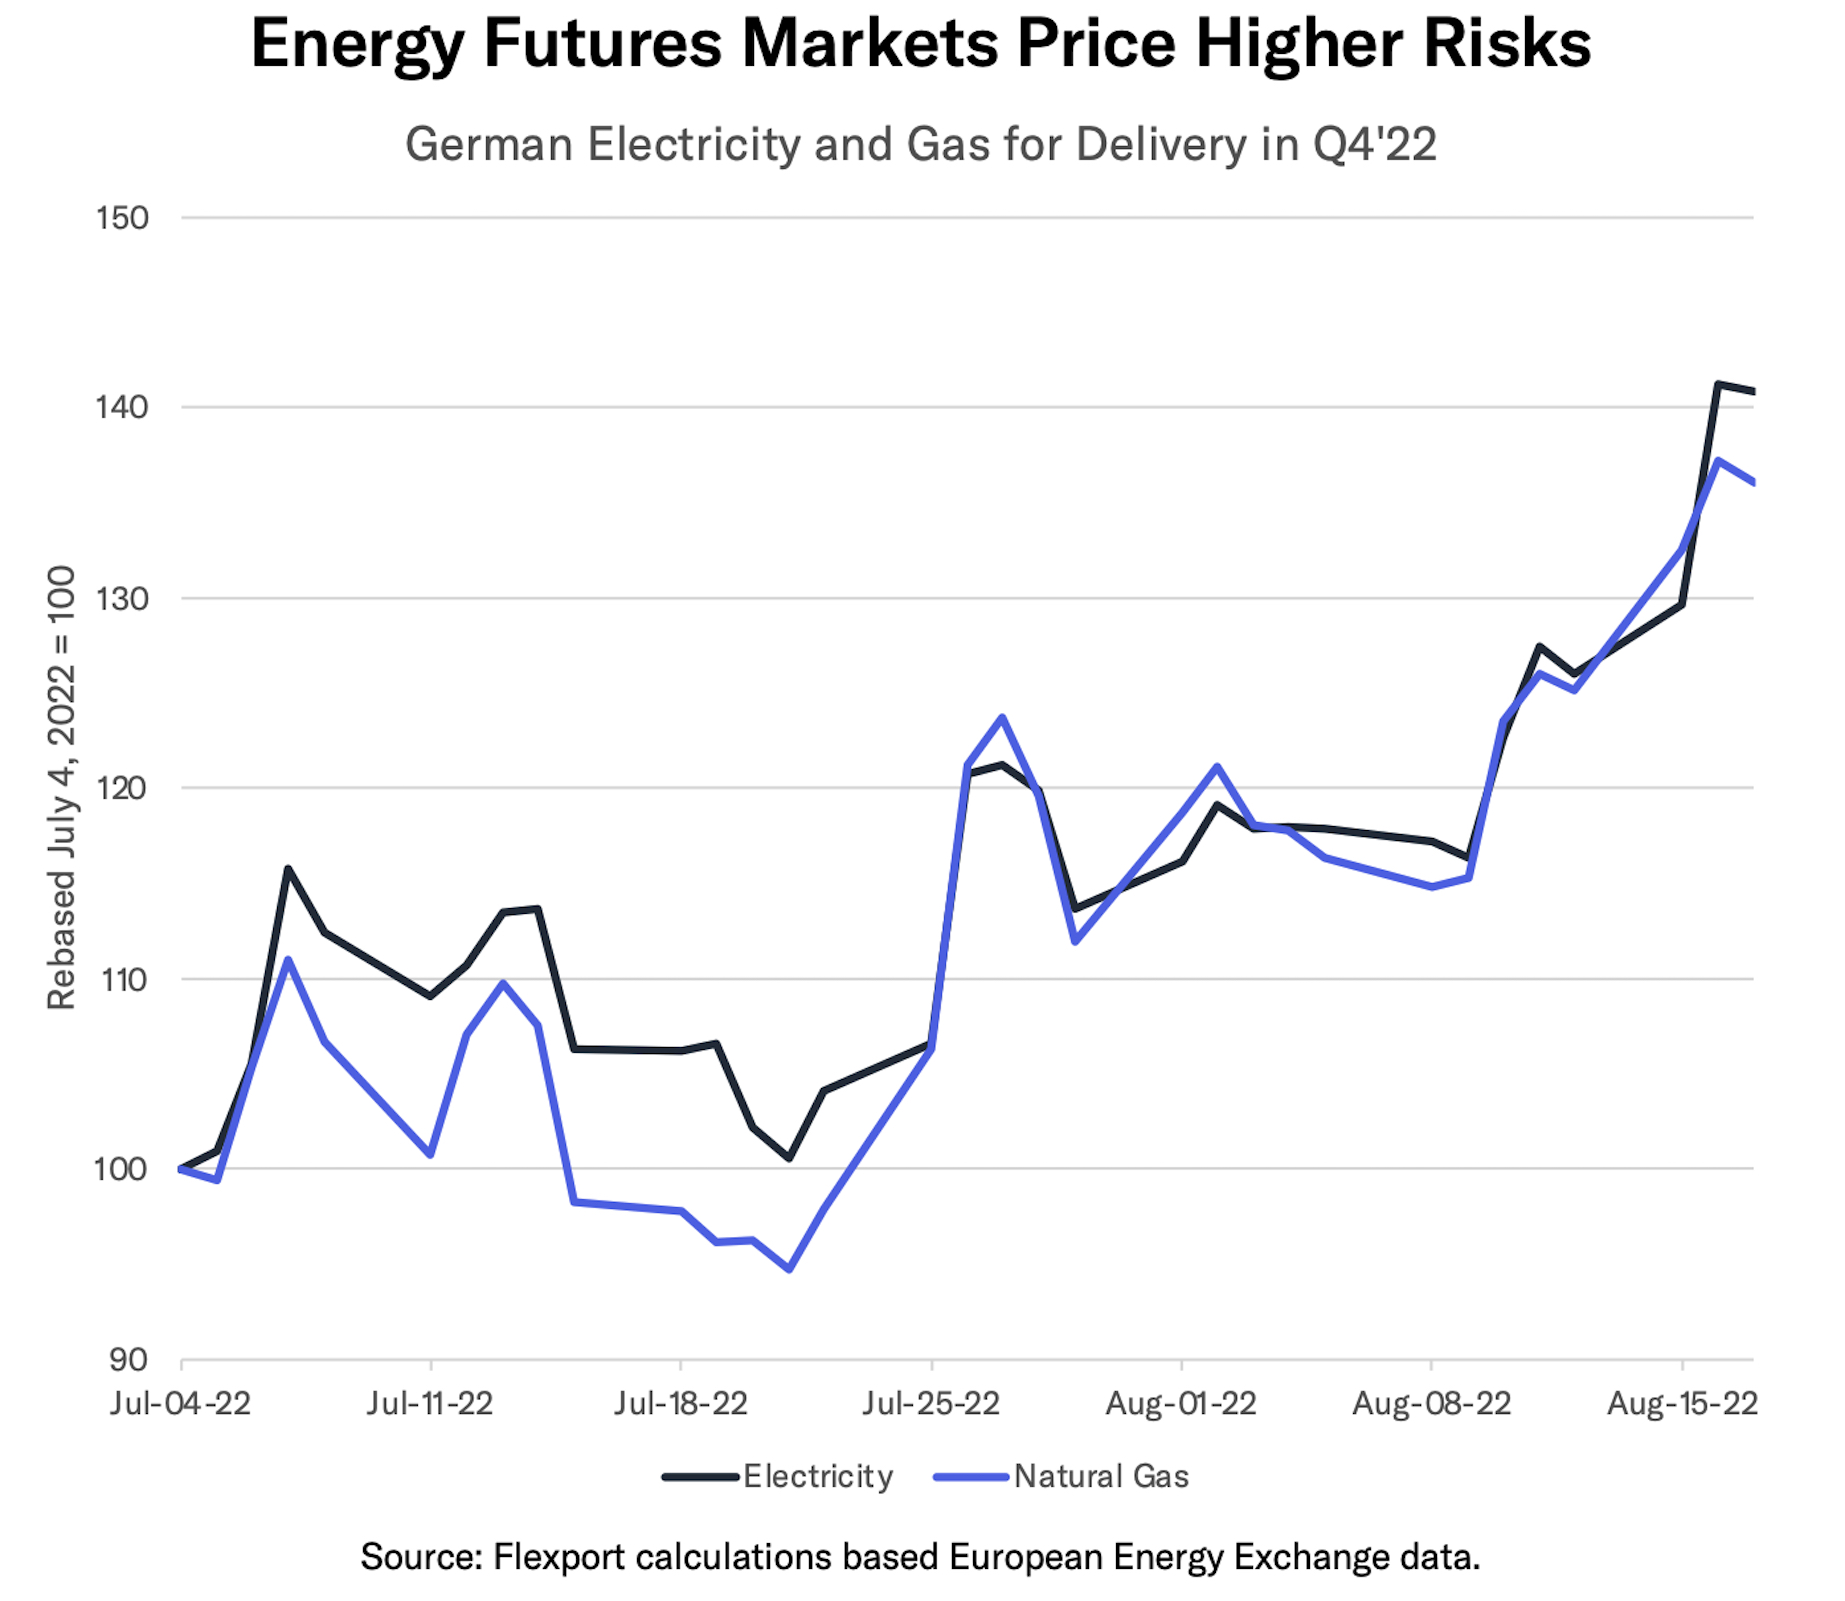
The chart above shows the “futures price” for delivery of electricity and natural gas in Germany in Q4’22. That represents traders’ best bet on the balance of future supply and demand conditions heading into the winter.
Futures prices for both commodities have risen by around 40% since the start of July. The correlation between the two reflects the use of natural gas in power generation. For context, the price for delivery of electricity in Q4’22 is 564 euros per megawatt-hour (MWh), as of August 17. That compares to 179 euros per MWh in Q4’21 and 39 euros per MWh in Q4’20, i.e., a 14.5x increase in 2022 versus 2021. An average EU household uses 3.7 MWh per year.
What does all of this mean for the wider economy? There are two major factors to consider: the impact on already-elevated inflation; and the potential for physical constraints on energy supplies to industrial production.
Producer Price Inflation (PPI) in the Euro area reached 35.8% year-over-year in June, including a 92.8% rise in energy and a record high in PPI in Germany. Higher energy, metals and food prices have fed into increased durable and nondurable producer prices, which climbed 9.5% and 13.4% respectively. Elevated producer prices are already feeding into higher consumer prices.
For industrial production, there may be interuptions to energy deliveries even before supplies run out. The European Commission has already outlined plans for rationing over the winter, which will include industrial and commercial gas and power users.
Major manufacturing users of natural gas include the petrochemicals, fertilizer, plastics and paper industries. Almost all major industrial manufacturers use electricity. Many have contracts that include clauses that allow electricity providers to interrupt supplies with minimal notice, to ensure balance between supply and demand across the power grid.
There are already reports of closures of zinc and aluminum plants in response to higher costs. Manufacturing business expectations in Germany have already dropped to their lowest level since April 2020.
Reduced supplies of materials that use natural gas and electricity may also have downstream supply chain effects. That may be a particular challenge for sectors with just-in-time supply chains, including packaged food, autos, complex consumer durables and industrial machinery.
Other risks to consider include: winter temperatures, which will drive consumer energy demand; the progress of the Ukraine conflict; energy demand trends elsewhere in the world; and technical factors such as U.S. production and storage.
The surge in futures prices for natural gas, considerable uncertainties about the physical availability of gas and power, and the continued conflict in Ukraine should give all supply chain planners plenty of cause for concern this winter.
You can now receive the Weekly Economic Report straight to your inbox every Monday by signing up here.
Latest Flexport Metrics & Research
The Flexport Ocean Timeliness Indicator for Transpacific Eastbound (TPEB) routes fell to 86 days in the week to August 21, its lowest since July 2021. Flexport’s Air Timeliness Indicator meanwhile held at the 11 day average which has prevailed since early May.
Recent Flexport research reports include our analysis of the potential impact of the port strike at Felixstowe, which got underway on August 21. It could take several weeks for the port to recover and the impact on global logistics networks to unwind.
Economics Data
U.S. retail sales were unchanged in July versus June, on a seasonally adjusted basis. Sales of autos and sales by gasoline stations both fell, by 1.6% and 1.8% respectively. Sales of furniture and home appliances stores improved after two down-months, but are still 3.9% lower than a year earlier.
- Retail inventory-to-sales increased to 1.21x in July, marking the highest since February 2021. The ratio for autos now stands at 1.39x, the highest since February 2021 but still well below 2019 average of 2.32x. Excluding autos, the ratio inched up to 1.16x, the highest since May 2021. Furniture and appliances now stand at 1.69x, the highest, aside from the depths of the pandemic, since October 2012.
Chinese retail sales increased by 2.7% year-over-year in July. That marked a dip from 3.1% a month earlier and included a slump in the growth in sales of personal care and autos. Sales of furniture and clothing have continued to decline.
U.K. consumer prices (headline CPI) rose by 0.6% sequentially and by 10.1% year over year in July. The latter was the fastest rate of U.K. headline inflation (RPI before 1990) since February 1982. The biggest contributors to the 0.6% headline increase were food / beverages, recreation and housing.
- Euro area harmonized consumer prices inched 0.1% higher sequentially in July and climbed by 8.9% year over year. Energy led the way with 39.6% annual growth, while food rose by 9.8%. Notably though, prices excluding energy and food rose by just 4.0% and actually dipped by 0.2% sequentially.
The U.K. Producer Price Index (PPI) increased by 0.1% in July versus June, its slowest increase since August 2020. Fuel prices were the main driver of the slowdown, while all the other major categories increased. On a year-over-year basis, PPI slowed to a still-considerable 22.6% from 24.1% a month earlier.
- German PPI increased by 37.2% year over year in July, the fastest rate of inflation on record. Energy prices were the main reason for the expansion. Intermediate goods prices rose by 19.1%, reflecting higher chemicals and metals commodity prices. Nondurable goods climbed 16.2% on higher food costs.
U.S. total industry capacity utilization rose to 80.3% in nominal terms, the highest level since August 2018. Industrial production increased by 0.6% sequentially in July in real terms and by 3.9% year over year. Manufacturing output grew by 0.7% sequentially, almost offsetting the declines of the two previous months.
U.K. consumer confidence set a new low since records began in 1974. The GfK’s barometer for overall confidence dipped to -44 (zero indicates a neutral outlook) from -41 a month earlier. The drop was led by a slide in personal finances as well as a decline in consumers’ general outlook for the economy. The “major purchases” index also continued to fall.
Japan’s merchandise trade rose by 32.7% year over year in July, in nominal terms. Energy accounted for half of the 47.2% growth in imports in yen terms. Exports grew by 19.0%, including a 20.8% increase in semiconductor exports and a 37.7% rise in semiconductor manufacturing machinery. Exports of cars rose by 13.5% and were above their 2019 level for the first time.
EU merchandise trade activity with the rest of the world increased by 33.4% year over year in June. That marked the 16th straight month of growth. Energy imports were the major driver, with imports from the U.S. and Russia up by 52.4% and 43.3% respectively.
- Exports to Russia were down by 38.5% year over year, though they have increased sequentially in May and June. That’s come despite steadily tightening sanctions.
Policies & Regulations
China’s Central Bank cut short-term lending rates, in a move to stimulate a slowing economy. Among the indicators of concern: new credit in July increased at the slowest rate since at least 2017.
The U.K. has announced the “Developing Countries Trading Scheme,” providing reduced tariffs for imports from developing economies. The DCST replaces the pre-Brexit Generalized System of Preferences and will lead to 750 million pounds of tariff reductions.
The U.S. and Taiwan will start formal discussions regarding trade promotion in the early autumn. The 11 areas of discussion, initially announced in June, will include trade facilitation, digital trade rules, agricultural trade enhancement and labor rules. A full trade deal, with widespread tariff reductions, does not appear to be on the agenda.
Supply Chain Update
Apparel makers may face a cotton shortage, after droughts have reportedly caused 40% of crops in the U.S. to be abandoned.
Russia’s refined oil products exports have reportedly risen to their highest since the start of the conflict. Crude oil exports have also remained above pre-conflict levels through August. While the G7 group of countries have applied sanctions, exports from Russia to China, India and others have supported continued flows.
The major container lines are starting to announce service adjustments to their services, ahead of this week’s strike at Felixstowe. So far five services (two by Cosco, three by Maersk) will omit their calls at the port. Recovery from the strike could take twice as long as the strike itself, as outlined in recent research.
Transportation of cars on river barges out of Germany via the Rhine face restrictions, as a result of reduced river flows. That may require additional shipping via train and truck.
Chart of the Week - Supply Chain Challenges Heat Up
Supply chains can’t catch a break. Authorities in Sichuan province, China, ordered factories in 19 out of 21 cities to shutter production from August 15 for one week. The need for power rationing, in the face of high temperatures, has been given as a reason. Aside from local manufacturing, there may also be a knock-on effect to production in other provinces resulting from reduced power supplies from the region. Firms in neighboring Chongqing have already reportedly started to slow production.
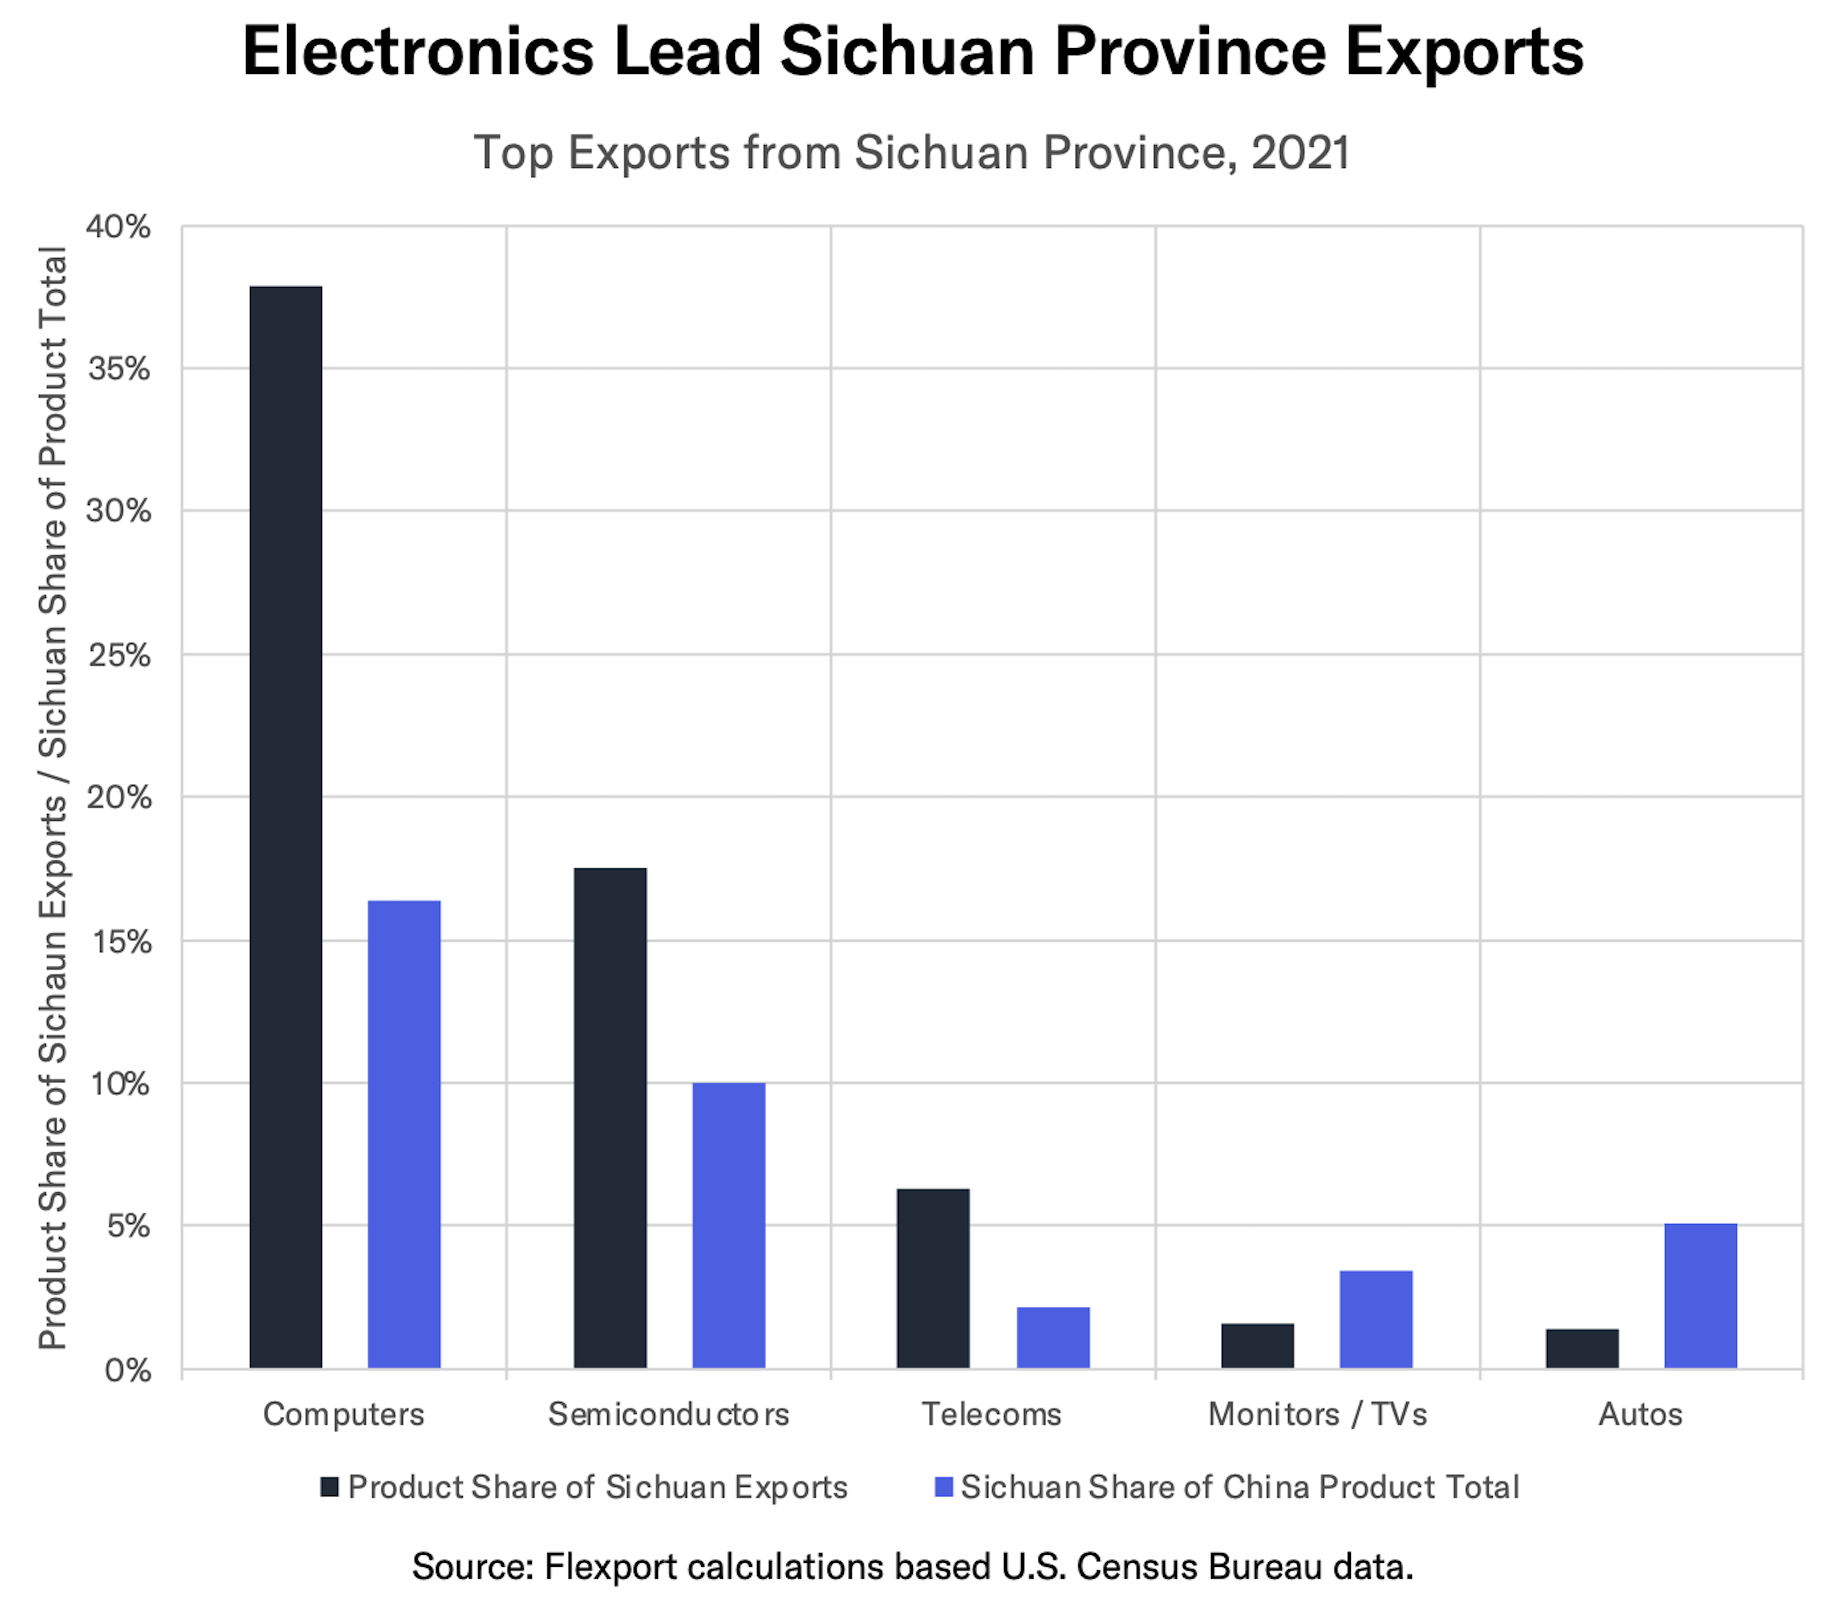
Which supply chains are most exposed to the closures? Press reports indicate factories that are shut include those operated by Foxconn and Toyota. The black bars in the chart above show the key exports from the province in 2021. Exports of computers, worth $33.5 billion according to China General Customs data, accounted for 38% of exports from the region.The indigo bar shows the share in total Chinese exports of a given product that come from Sichuan. In the case of computers, Sichuan accounted for 16.4% of total Chinese exports.
The top five export lines from Sichuan are dominated by electronics. Aside from computers, other major exports include semiconductors, where Sichuan represents 10.0% of Chinese exports, followed by telecoms products and televisions. The closures come on the cusp of the period of production for peak-season deliveries into the U.S. and European markets.
Disclaimer: The contents of this report are made available for informational purposes only and should not be relied upon for any legal, business, or financial decisions. Flexport does not guarantee, represent, or warrant any of the contents of this report because they are based on our current beliefs, expectations, and assumptions, about which there can be no assurance due to various anticipated and unanticipated events that may occur. This report has been prepared to the best of our knowledge and research; however, the information presented herein may not reflect the most current regulatory or industry developments. Neither Flexport nor its advisors or affiliates shall be liable for any losses that arise in any way due to the reliance on the contents contained in this report.
About the Author


