

December 15, 2023
Trade Activity Forecast Indicators
Trade Activity Forecast Indicators
December 15, 2023
Trade Activity Forecast: A Good Year for Exports
Flexport’s Trade Activity Forecast augments traditional economic techniques for predicting U.S. merchandise imports and exports with Flexport’s proprietary data. While US export growth has easily outpaced imports over 2023, the forecast shows imports starting to recover from a prolonged slump particularly as we move into 2024. The first half of 2023 saw imports fall from a monthly average of $227 billion to $222 but should rise back to $227 billion during the forecast period. We are predicting export growth to keep increasing in the forecast period after the mid-2023 slump. During the forecast period, the average value of exports is predicted to be $145 billion up from $135 billion during the 2023 mid-year slump, and are predicted to exceed the 2022 average of $132 billion by 10%.
The Methodology: The Flexport Trade Activity Forecast combines traditional economic statistics alongside Flexport’s proprietary data and analysis to generate a forecast of U.S. merchandise import and export trade growth. The use of additional data has been particularly important since the advent of the pandemic and resulting shift in trade patterns away from historic averages. See our primer report for more details.
Update December 15, 2023: The central version of Flexport’s Trade Activity Forecast presented here is a balance of payments version with seasonal adjustment (BOPSA) and correction for inflation. This best answers the question of whether this sector of the economy is performing better or worse than one would expect for a given time of year. The website also offers a Census, non-seasonally adjusted version better suited for users looking for a guide to activity within supply chains on a short-term basis. When adjusting for inflation, this captures the unadulterated forecast of how many goods are expected to cross U.S. borders compared to a year earlier.
Fig. 1 - U.S. Trade Rises into the New Year
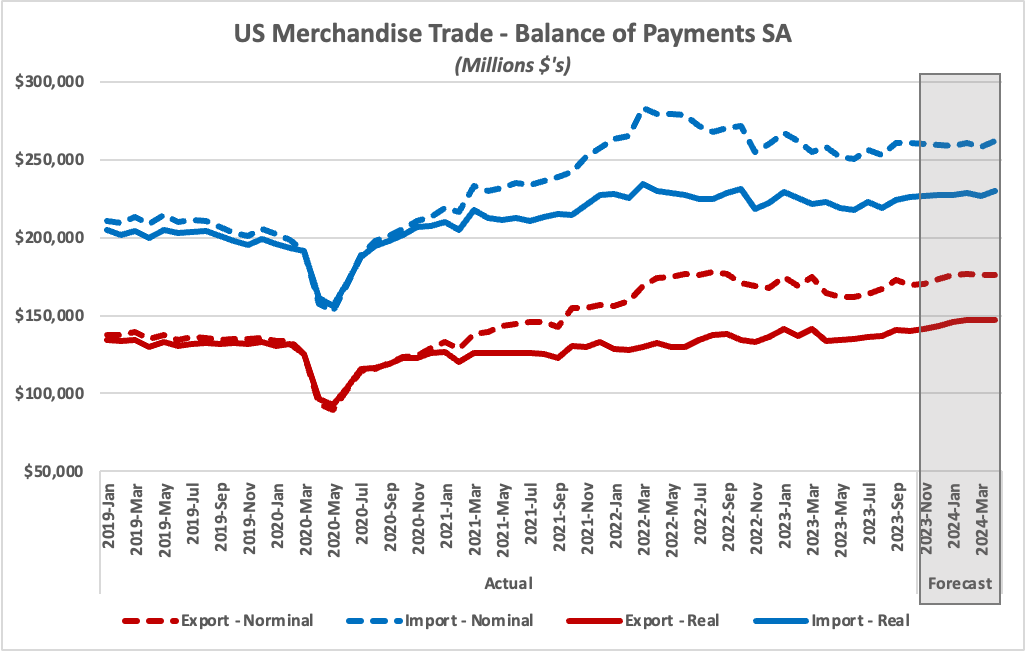
Figure 1 shows both real and nominal values for imports and exports, dating back to the start of 2019. The nominal (dashed) figures mostly serve to illustrate how misleading unadjusted numbers can be. We’ll focus here on the real (solid) values.
Our current forecast is for real imports to continue to grow over the forecast period – from October through April – by 1.7%. Exports are expected to grow by over 5.1%. Imports for April 2024 are projected to be about 2.9% higher than average 2023 levels while January 2024 exports are projected to be 6.3% higher than the 2023 average.
This increase in exports, coupled with slower growth in imports, is predicted to shrink the real trade deficit from $87 billion in October 2023 to $83 billion by April 2024.
Fig. 2 - Capital Goods are Driving Imports

Overall we are forecasting an increase in imports during the forecast period. Real imports are forecast to rise by 1.7% by April 2024. This is mainly caused by Capital Goods imports which are forecast to rise 4.7%. The only other import category predicted to rise is Industrial Goods (which includes petroleum) which looks to be 1.3% higher by April. All other categories are forecast to decline over the forecast period with Automotive showing the largest decline of 2.7% over the forecast period; Consumer Goods are expected to decline by 1.5%. Looking back to the beginning of 2023, only Capital Goods imports show a notable increase.
Fig. 3 - Exports of Autos and Capital Lead the Pack

Figure 3 conducts the same exercise for real exports. We project that U.S. exports will grow by over 5% through April 2024. Automotive exports are forecast to have the largest rise of over 9% through the forecast period. Consumer Goods exports are forecast to rise almost as much with a predicted increase of 8.9% through April 2024. Industrial Goods are also predicted to have a large increase of 6.3%. The two other categories are expected to be flat over the forecast period. Looking back to the start of 2023, only Consumer Goods imports look to end our forecast period with a notable diminution.
The U.S. Bureau of Economic Analysis will publish November data on January 9, 2024.
Please direct questions about the Flexport TAF to economics@flexport.com.
The contents of this report are made available for informational purposes only and should not be relied upon for any legal, business, or financial decisions. Flexport does not guarantee, represent, or warrant any of the contents of this report because they are based on our current beliefs, expectations, and assumptions, about which there can be no assurance due to various anticipated and unanticipated events that may occur. This report has been prepared to the best of our knowledge and research; however, the information presented herein may not reflect the most current regulatory or industry developments. Neither Flexport nor its advisors or affiliates shall be liable for any losses that arise in any way due to the reliance on the contents contained in this report.
Flexport Indicators
| Indicator | Published | Details |
|---|---|---|
| Air Timeliness Indicator | Weekly | Learn More |
| Ocean Timeliness Indicator | Weekly | Learn More |
| Flexport Consumption Forecast | Monthly | Learn More |
| Trade Activity Forecast | Monthly | Learn More |
| Post-Covid Indicator | Monthly | Learn More |
| Southeast Asia Sectoral Cost Indices | Quarterly | Learn More |
About the Author
December 15, 2023


