

June 13, 2022
Stop Being So Negative - Flexport Weekly Economic Report

Stop Being So Negative - Flexport Weekly Economic Report

The ECB has arrived late to the monetary policy tightening party but is more hawkish than expected. The structure of its actions - alongside those of the Fed - could have significant disruptive implications for financial market functioning as well as for consumers’ wallets.
In Focus - The ECB Tightens Monetary Policy
The European Central Bank has started to tighten monetary policy - three months after the Fed, six months after the Bank of England and after 60 other central banks started tightening.
How will the ECB do it? First, the ECB will end its purchases of bonds, or quantitative easing (QE) from July 1. It will then start to raise interest rates by 25 basis points in July with a “larger increment” (i.e. perhaps another 50 basis points) to follow from September. The rate rises were quicker than markets had expected.
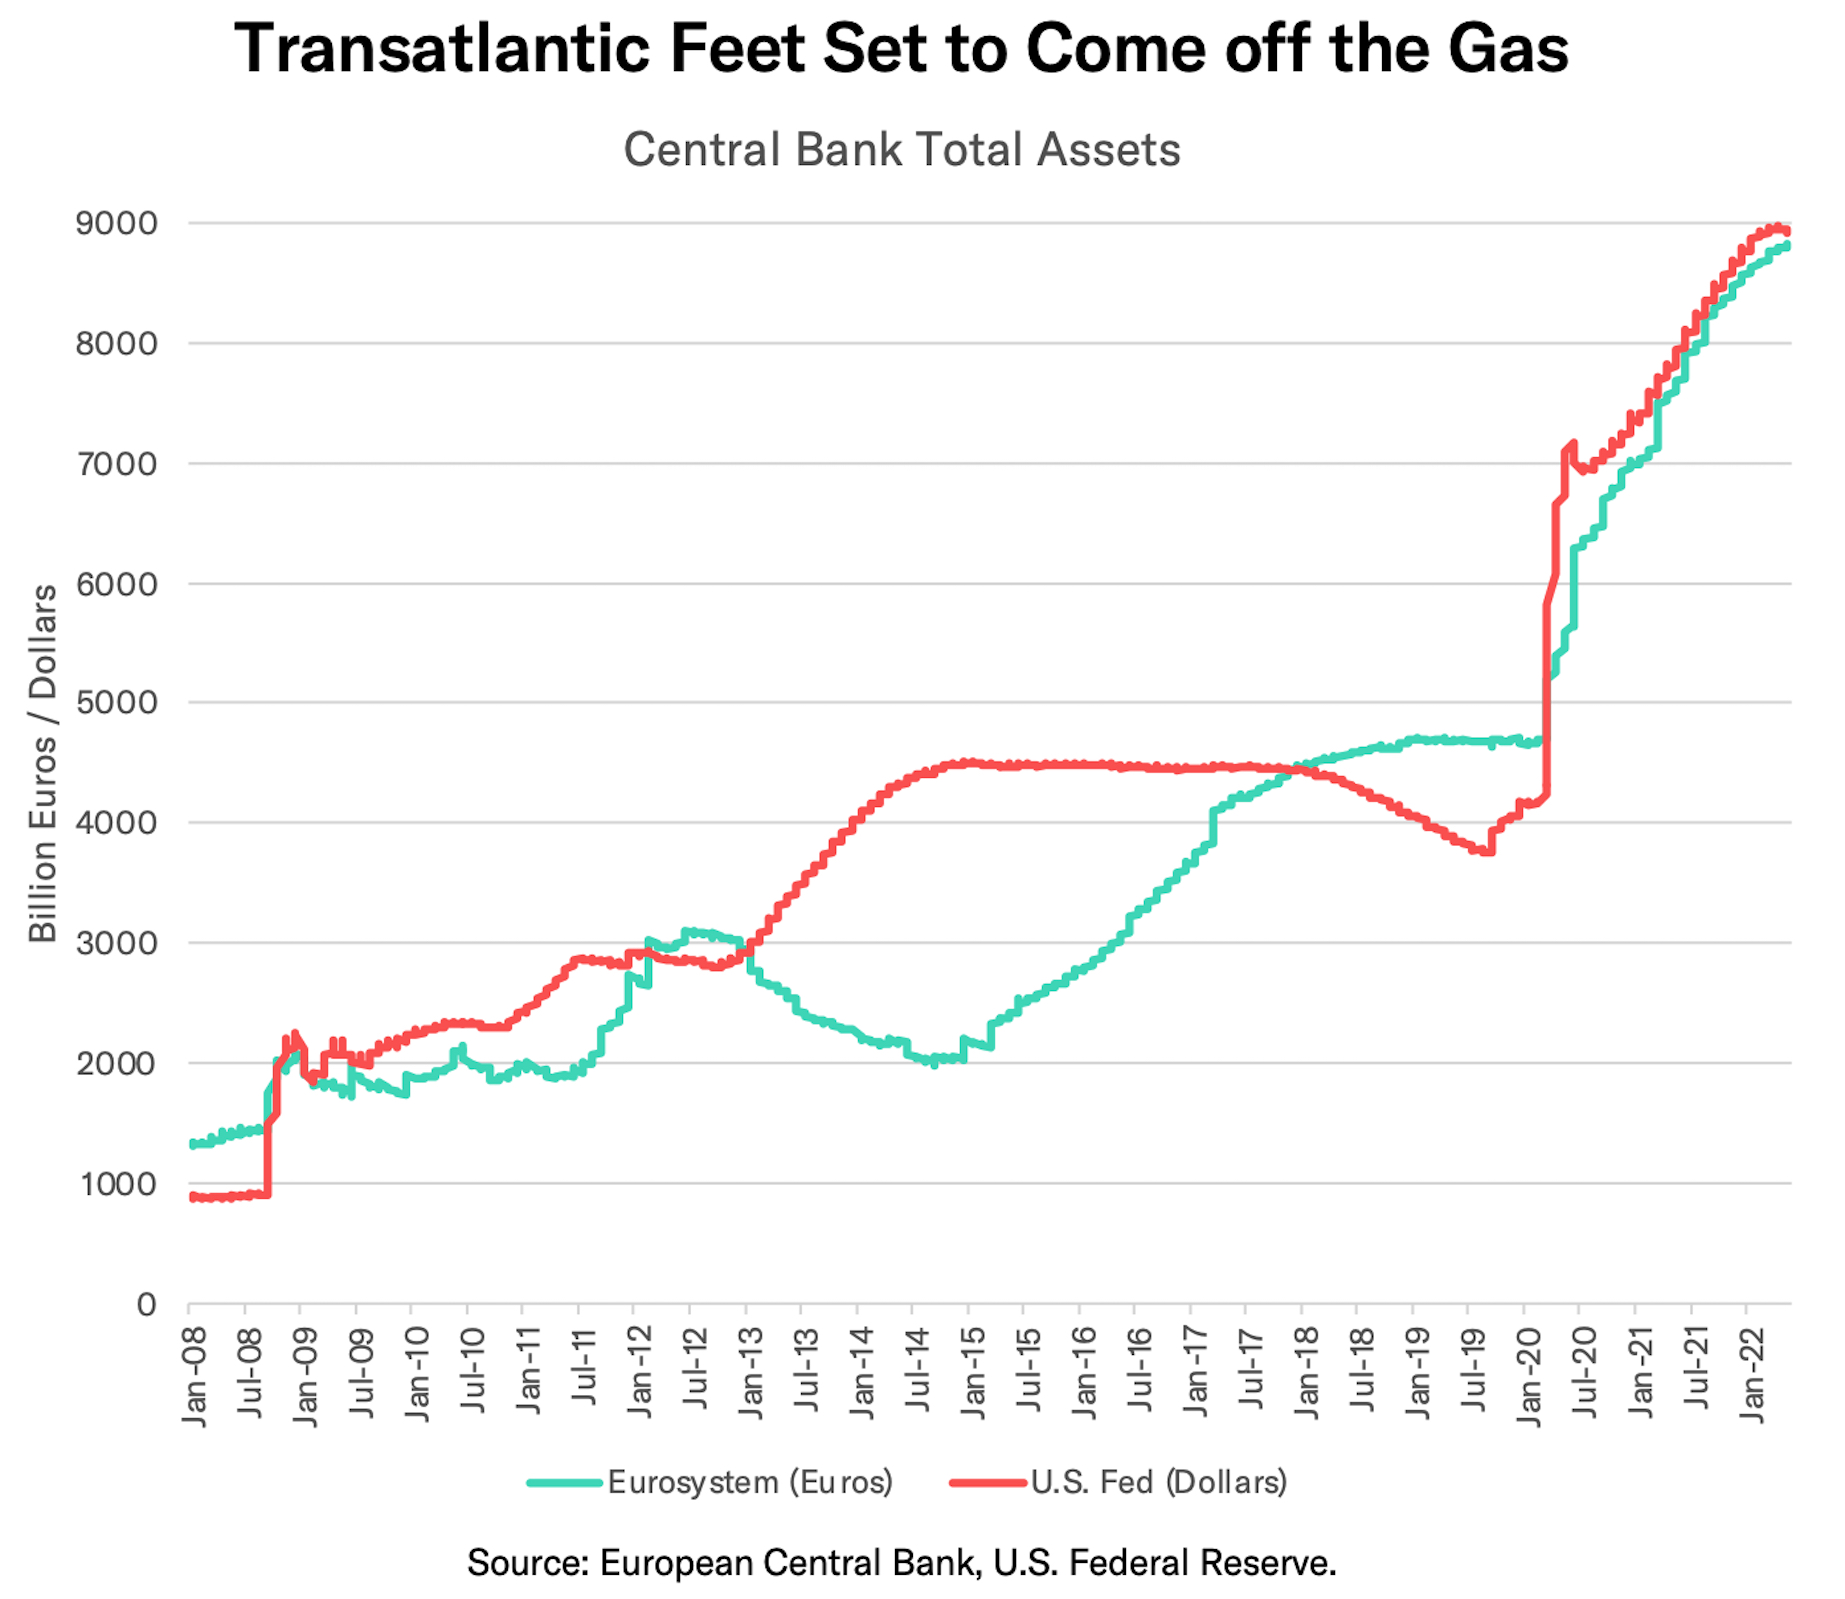
The ECB deposit rate had been set at negative 0.5% (nominal - before inflation adjustment) and has been negative since June 2014, after a prior period of below-target inflation. When negative nominal rates - which the Fed and BoE had avoided - failed to boost spending and inflation in H2’14, the ECB started expanding its QE program in early 2015. It accelerated again during the pandemic.
As shown in the chart above, the Eurosystem (ECB plus national central banks) total balance sheet reached 8.82 trillion euros in May 2022. QE had already slowed, reaching just 7 billion euros per week in April and May compared to 24 billion a week in the prior 12 months.
Why now? Simply put: sustained inflation. Eurozone CPI reached 8.1% in April and as high as 19.1% in the Baltics. It had already been 5.0% in December with the recent run-up boosted by the commodity price boom linked to conflict in Ukraine. The ECB had previously delayed action because of concerns about the impact of the conflict.
Those uncertainties appear to have cleared and the ECB has raised its inflation forecast to 6.8% for 2022 (from 5.1% previously). ECB President Christine Lagarde noted “inflation pressures have broadened and intensified” and that “risks are primarily on the upside”.
So what will the impact be? First, If ECB rates go up and inflation goes down, then one would see real interest rates rise (after inflation adjustment). If that’s the case, hard-pressed consumers will need to contend with those higher interest rates as well as the ongoing impact from reduced disposable incomes due to existing inflation, if compensation does not keep up with inflation. Retail spending could slow.
Second, financial markets also face a prolonged period of extreme uncertainty. The ECB will initially reinvest funds from maturing bonds until the end of 2024. However, with wide differentials in effective borrowing rates across the Euro Area (10 year bond yields in Italy are 3.6% vs. Germany’s 1.5%) the nature of that reinvestment will matter. Lagarde also stated that there is a need to “avoid fragmentation” - will that mean continued purchases of emerging European bonds rather than northern European bonds?
Third, at the same time, the Federal Reserve is also rolling off its own QE program. During the pandemic the two central banks’ programs have synchronized but in the prior decade they had run at counterpoints potentially offsetting each other. Inflation looks set to continue but the impact of globally synchronized, tightening monetary policy is far from certain.
It can be difficult to compare tightening programs, as central banks on each side of the Atlantic are adjusting both policy rates and balance sheets. Whichever country is seen as tightening more persuasively should see its currency strengthen against the other. For both the year to date and this last week, the dollar has risen against the euro.
Please note that the next edition of the Flexport Weekly Economic Report will be on June 21st as we’ll be taking a day to honor Juneteenth.
Latest Flexport Metrics & Research
The Flexport Ocean Timeliness Indicator for Transpacific Eastbound routes fell to 99 days in the week to May 12, marking its lowest reading since September 26, 2021. Flexport’s Air Timeliness Indicator meanwhile remained inline with the level it has been at throughout Q2’22 so far.
In other research we produced a deep-dive into the state of the U.S. warehousing sector, including capacity utilization and new data on pricing from WarehouseQuote. We’ll be incorporating the latter into our Logistics Pressure Matrix.
Economics Data
U.S. CPI showed accelerating inflation in May. The Consumer Price Index was up 8.6% over 12 months, the largest increase since December 1981. While food and energy inflation helped drive the headline number, “core” CPI – excluding food and energy – was still up 6.0% year over year. Nor was this just goods and supply chains; services (excluding energy services) were up 5.2%, with shelter rising by 5.5%.
U.S. household net worth fell by $500bn in Q1 of 2022. It was the first drop since the pandemic recovery began and it reflected a $3 trillion drop in the value of stocks, partially offset by a $1.6 trillion increase in the value of real estate and continued personal saving. Household debt grew at an 8.3% annual pace.
U.S. international trade activity fell by 0.6% sequentially in April, the first decline since September. A 4.4% reduction in imports of goods was the main driver, led in dollar terms by a c18% drop in computers, textiles and toys. At the other end of the spectrum automotive imports rose by 4% on strong shipments of tires and trucks. Exports of goods, meanwhile, rose by 3.6%, led by increases in industrial supplies and materials and soybeans.
- Canadian merchandise trade meanwhile improved by 1.2% sequentially in April, aided by record high trade levels with the U.S. Exports of energy, which rose by 11% in total, were the main driver (see above on oil prices). Trade with the EU and China declined, likely reflecting reduced metals and forestry exports.
Japan's Producer Price Index rose by 9.1% in the year to May. Even more impressive was the 43.3% jump in import prices in the year to May, the biggest jump since the data began being collected in 1981. The numbers are significantly influenced by a sharp depreciation in the Yen. PPI
- In China, producer prices increased by only 6.4% in the year to May, the lowest rate in 14 months.
Mainland China’s merchandise trade activity in May increased by 11.1% year over year, driven by a 16.9% bounce in exports. The latter was better than the 8% expected by economists and may reflect a rapid rebound from factory closures. Growth was helped by an 18% rise in both telecoms and semiconductor products.
- Exports from Taiwan meanwhile grew by a more modest 12.5% year over year in May despite shipments to China rising by just 0.8%. Exports of semiconductors surged 28.3% year over year.
- India’s goods imports jumped 56% year over year in May on the back of a 96% surge in shipments of crude oil products and a 2.7x rise in coal imports. Export growth of 16% was similarly flattered by shipments of refined oil products, without which they rose by 8%.
Policies & Regulations
The Biden Administration’s Americas Partnership for Economic Prosperity (APEP) is far from being a new trade deal. Instead, like its Indo-Pacific equivalent, it focuses on engagement in topics ranging from labor standards (including forced labor), supply chain visibility and renewable energy.
The U.S. government continues to debate reducing tariffs on imports from China, as discussed in recent Flexport research. The latest comments from Treasury Secretary Yellen suggest a plan to “reconfigure” rather than cancel tariffs is under consideration. That may allude to reducing consumer goods tariffs but keeping those on components and electronics.
A new set of policy actions on renewable energy from the Biden administration will include: use of the Defense Production Act to promote solar panel and heat pump production; domestic content standards for federal renewables purchasing; and tariff free imports of solar panels from four South-East Asian countries.
- The latter is the most controversial with the Trump administration having previously applied Section 201 “safeguarding” tariffs on imports of solar panels. The four countries covered accounted for 65% of U.S. imports in 2021 (source U.S. Census Bureau), with a value 13% lower than their peak in the 12 months to Aug. 31 2020.
The European Parliament has voted down a proposal to extend the greenhouse gas Emission Trading Scheme as well as a series of other measures including the Carbon Border Adjustment Mechanism. The surprise result will further delay the implementation of CBAM, extending uncertainties for metals and construction material supply chains.
The World Trade Organization’s 12 Ministerial Conference is being held from June 12 to June 15. The most pressing matter is arguably a “TRIPS” intellectual property waiver for COVID-19 vaccines while food protectionism will also likely be a focus. A deal on fisheries is long overdue while a deal on dispute settlement seems unlikely.
Supply Chain Update
Smartphone supply chains may be going from supply shortages to demand challenges. IDC’s global smartphone shipment forecasts have been cut to a 3.5% drop year over year in 2022 from a 1.6% increase previously due to reduced demand in China.
- A major chipmaker has indicated that its “utilization rate is full for the rest of the year” with a mix of PC, electric vehicle and smartphone demand.
- Technology supply chains more generally may however start to face component supply challenges after Russia announced plans to limit exports of noble gases. It’s also worth noting Ukraine is the leading supplier of neon.
OPEC has agreed to increase crude oil output by 648k barrels per day in July and August, up from a rate of 432k barrels per month previously.
- That has not prevented a rise in oil prices which are holding at $120 per barrel WTI given (a) the 648k barrels increase only add 0.7% to global demand (b) most countries are already at full production and (c) OPEC production is already 2.6 million barrels behind schedule.
- The reshaping of global oil supplies resulting from sanctions against Russia continues. The U.S. will reportedly exempt Italian and Spanish refiners from sanctions against oil imported from Venezuela. India’s refiners meanwhile are expected to further increase their purchases of Russian oil at a discount to market prices.
- U.S. attempts to mitigate the shortage of refined oil meanwhile include moves by the EPA to increase the amount of ethanol that producers of gasoline are required to buy. That follows a rise in RBOB gasoline prices to new record highs of $4.70 per gallon wholesale.
The U.S. is also reportedly looking to reduce its dependence on imported uranium from Russia as part of a wider rethink of energy supply chains. U.S. imports of Russian uranium and related products were worth $645 million in 2021 (source: U.S. Census Bureau) or 26% of the total.
An explosion at a liquefied natural gas facility may cut U.S. LNG exports by one-fifth for at least three weeks. Global natural gas markets have been trying to adapt to European attempts to shift purchases away from Russia and to LNG imports from the U.S.
The world’s leading fertilizer producer will reportedly increase its production of potash by 40% by 2025. The additional capacity will leave it with 18 million tons of production, adding as much as a tenth to global production. That comes in the wake of disturbances to fertilizer supplies caused by the conflict in Ukraine and related sanctions.
Chart of the Week - Record High Food Costs
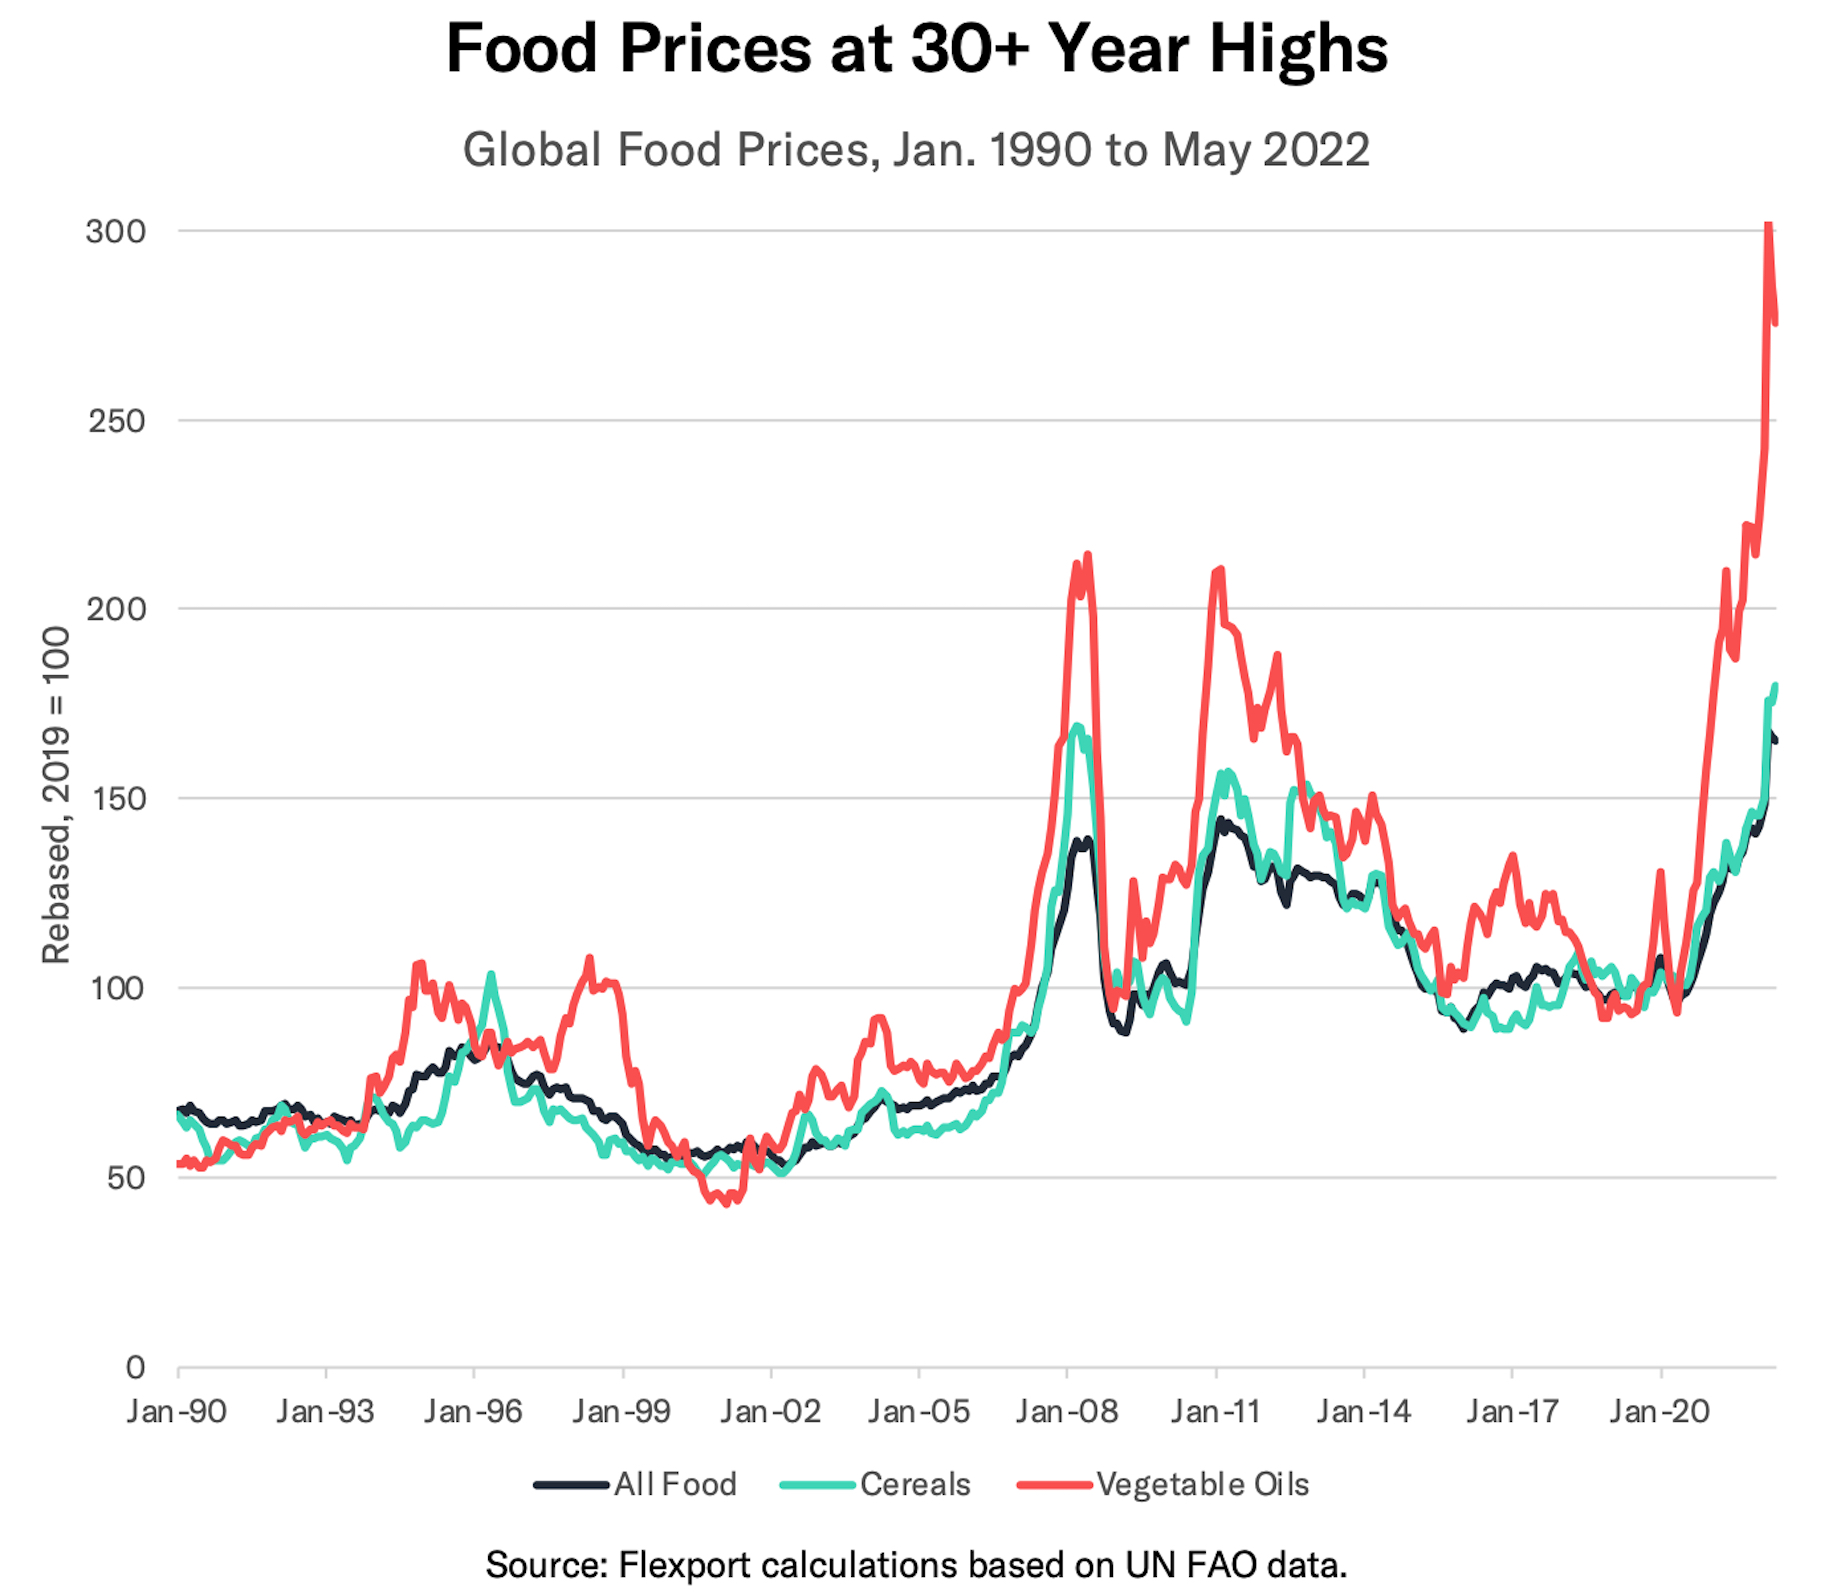
New data from the United Nations shows global food prices dipped by 1.5% from their March peak in May. It’s too soon to celebrate a return to normality however. First, the dip has been largely driven by a 9% decline in vegetable oils since their March peak on a removal of export restrictions by Indonesia.
Second, there’s still plenty of protectionism in place. Third, the conflict in Ukraine is keeping wheat prices at record highs with a plan to resume shipments reportedly struggling. Related sanctions are also complicating both food flows and fertilizer markets. Finally, the usual vagaries of weather and input-costs continue to play a part in availability.
The complete food price series is at its highest since records began in 1990. With higher food commodity prices feeding into CPI, governments in both the developed and emerging markets are enacting policies to control or offset higher costs.
Disclaimer: The contents of this report are made available for informational purposes only and should not be relied upon for any legal, business, or financial decisions. Flexport does not guarantee, represent, or warrant any of the contents of this report because they are based on our current beliefs, expectations, and assumptions, about which there can be no assurance due to various anticipated and unanticipated events that may occur. This report has been prepared to the best of our knowledge and research; however, the information presented herein may not reflect the most current regulatory or industry developments. Neither Flexport nor its advisors or affiliates shall be liable for any losses that arise in any way due to the reliance on the contents contained in this report.
About the Author


